Content Performance Analytics: A Practical Guide for 2026
Learn how content performance analytics turns reach into results. Discover methods, metrics, and forecast-versus-actual workflows creators actually use in 2026.
Upkeep · 2026-08-27 · 47 min
You publish a post that feels strong, watch the reach climb, and wait for the audience growth to follow. Instead, the impressions rise while profile visits, follows, and repeat readers barely move. The dashboard looks busy, but it doesn't tell you whether the post created durable demand or merely passed through a large, indifferent audience.
Content performance analytics becomes useful when it stops being a collection of charts and becomes a forecast-versus-outcome learning loop. Before publishing, you form a hypothesis about likely distribution and audience response. After publishing, you compare the predicted range with measured reach, inspect the path from attention to conversion, and record what should change next time. That process turns every post into training data for the next decision.
The market surrounding social-media analytics reflects this shift. Grand View Research estimated the global market at USD 10,229.8 million in 2024 and projected it to reach USD 43,246.7 million by 2030, implying a 27.2% CAGR from 2025 to 2030, as reported in this market outlook published by Yahoo Finance. Measurement has moved beyond vanity reporting. The practical question is no longer whether a post received attention, but what that attention produced and how accurately the next post can be planned.
Table of Contents
- When Reach Goes Up but Followers Do Not
- The Five Metrics That Actually Define Content Performance
- How Forecast Ranges Are Built from Public Signals
- Engagement Rate Is Not the Answer, Here Is What Is
- Reading a 72-Hour Performance Replay Like a Practitioner
- Why Follow Conversion Beats Vanity Metrics Every Time
- Turning Analytics into a Weekly Learning Habit
When Reach Goes Up but Followers Do Not
Lena had a familiar problem. She published a thread that the platform served to 84,000 impressions, but her account gained only 41 followers in 72 hours. The post looked successful in the first screenshot and disappointing in the second.
Her dashboard showed that distribution had worked. The platform had found enough people to test and circulate the thread. The weak point appeared later, between exposure and commitment. Readers saw the idea, but too few visited her profile, understood what she offered, and decided they wanted more from the account.

Reach is upstream and conversion is downstream
Reach answers an upstream question: did the distribution system put the post in front of people? Follow conversion answers a downstream question: did those viewers see enough value to make the relationship persistent?
Treating the first answer as proof of the second creates bad decisions. Lena could have repeated the same broad hook because it generated exposure, even though the post attracted readers who had little reason to follow. She could also have dismissed the topic entirely, missing the fact that the thread's distribution was healthy and its profile promise was unclear.
A useful replay records three things:
- Predicted reach range: What distribution seemed plausible before publication?
- Measured outcome: What reach, replies, shares, clicks, visits, and follows occurred?
- Calibration note: Which assumption was too optimistic, too conservative, or aimed at the wrong outcome?
Practical rule: Reach tells you where the funnel opened. Follower conversion tells you whether the audience wanted the next post.
The distance between those measures is where learning happens. A post can undershoot its reach forecast but convert the viewers it does receive exceptionally well. Another can overshoot distribution and produce little lasting audience value. Both outcomes teach you something different.
The rest of the measurement system should preserve that distinction. Use layered metrics to identify where attention is gained or lost, forecast with explainable signals rather than false precision, and replay results at consistent checkpoints. The objective isn't a prettier dashboard. It's a better hypothesis for the next post.
The Five Metrics That Actually Define Content Performance
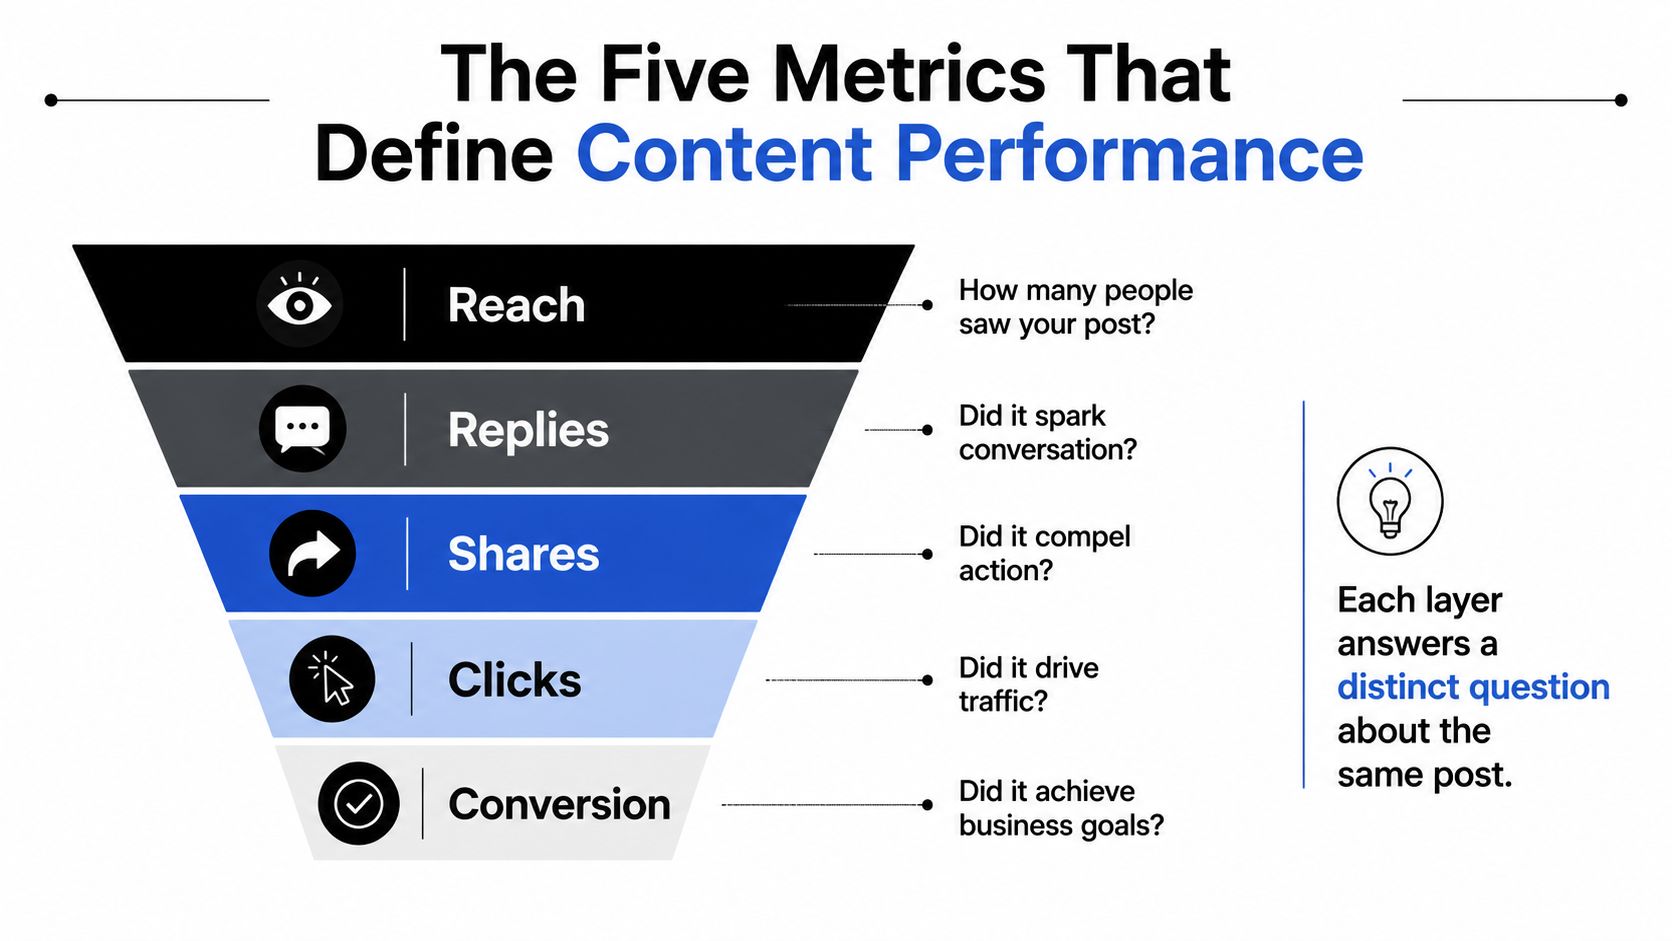
A post isn't one event. It's a sequence of decisions made by viewers, and each decision needs its own measure. Reach, replies, shares, clicks, and conversion form a practical funnel because they describe different stages of the same reader journey.
Start with distribution, not applause
Reach asks whether the post was shown to enough people to create an opportunity. A low reach result can point to weak early signals, poor timing, limited account distribution, or a topic that didn't travel beyond the existing audience. It can't tell you whether the content was persuasive once seen.
Replies measure active response. A reader who writes a reply has done more than register an impression or tap a low-friction reaction. Examine whether replies introduce an experience, ask a useful question, or create a follow-on conversation. A large reply count with little substance can flatter a post without proving that the idea has depth.
Shares test portability. People share ideas that help them express an identity, teach someone else, or add useful context to a conversation. A share is often more valuable for distribution than a like because it places the idea inside another person's network and reputation.
Follow intent through the lower funnel
Clicks capture a clearer exchange of attention. The reader leaves the feed for a destination, whether that's an article, product page, signup form, or profile. Clicks don't guarantee satisfaction, so pair them with destination behavior when you can.
Conversion records the action that matters for the publishing goal. On social accounts, that may be a follow, save, or profile visit followed by a follow. For a business, it may be a signup or qualified inquiry. The correct conversion event depends on the job the post was designed to perform.
Read the metrics sequentially:
- Reach: Did people see it?
- Replies: Did the opening earn a response?
- Shares: Was the idea portable?
- Clicks: Did interest become intent?
- Conversion: Did intent produce the desired outcome?
Optimizing one layer in isolation distorts the whole system. Chasing reach can attract an audience that won't convert. Chasing replies can reward controversy over usefulness. Chasing clicks can produce traffic that leaves quickly. A strong post doesn't need to maximize every layer. It needs to perform well at the layer that matches its purpose, without creating a hidden failure farther down the funnel.
How Forecast Ranges Are Built from Public Signals
A pre-publish forecast should explain why a post may travel, not pretend to know exactly what a platform will do. The ranking model remains partly opaque, and no public-signal analysis can guarantee distribution. A useful forecast therefore produces a range, records its inputs, and makes uncertainty visible.
A practitioner can organize the estimate into five buckets:
- Account baseline: Prior impression behavior establishes the account's normal distribution context. A recent baseline helps prevent one unusually strong post from becoming the expected standard.
- Format fit: Compare the draft with posts using the same format. A short observation, long thread, reply, image, and link post shouldn't share one undifferentiated benchmark.
- Hook strength: Score the opening against historical patterns such as early reading behavior, replies, or open-rate performance where those measures exist.
- Posting-window fit: Compare the planned time with the audience's activity curve. Account-specific timing is more useful than a universal “best time” rule, which is why creators can review historical posting-time guidance rather than copy a generic schedule.
- Topic novelty: Estimate whether the subject has enough freshness or cross-account conversation velocity to earn attention beyond the usual audience.
These inputs are explainable. They show the creator what changed between one forecast and another. The platform's ranking system still decides final distribution using signals the publisher can't fully observe, including the response of early viewers and the context of competing posts.
| Signal | Weight Range | Source | Confidence |
|---|---|---|---|
| Account baseline | Account-specific | Recent account history | Medium |
| Format fit | Account-specific | Similar published posts | Medium |
| Hook strength | Comparative score | Historical opening response | Medium |
| Posting-window fit | Account-specific | Audience activity curve | Medium |
| Topic novelty | Comparative score | Cross-account conversation activity | Low to medium |
| Platform ranking response | Not publicly defined | Platform behavior after publishing | Low before publication |
Where forecasts should stay humble
Forecasts overclaim when they turn a sparse history into a precise point estimate. They also fail when they confuse public engagement signals with business outcomes. A post can receive broad distribution because its topic is timely, then produce weak follower conversion because the account's positioning doesn't match the audience it reached.
The calibration loop fixes neither problem instantly. It does create a record of error. After publication, compare the actual result with the lower and upper bounds, then identify whether the miss came from account history, format assumptions, timing, hook interpretation, or topic novelty. Next week's forecast should change because the evidence changed, not because the creator felt disappointed.
Engagement Rate Is Not the Answer, Here Is What Is
Raw engagement rate compresses unlike actions into one reassuring number. It can help with a quick scan, but it shouldn't carry the entire performance diagnosis. A small post can collect enthusiastic reactions from existing fans, produce a high rate, and still add little new audience value.
A better review uses measures that preserve context and intent.
| Metric | What it answers | What it hides | Typical distortion |
|---|---|---|---|
| Normalized engagement per 1,000 impressions | How much active response did the post earn for its exposure? | Whether responses came from new or existing viewers | A loyal audience can inflate response quality |
| Dwell time or read-through | Did readers stay with the argument? | Whether they took a later action | Long attention can end without conversion |
| Reply quality score | Did the post create substantive conversation? | Silent readers who found it useful | Short agreement replies can inflate volume |
| Saves or bookmarks | Did the reader mark the idea for later use? | Whether the saved idea is ever revisited | Practical posts can earn saves without immediate reach |
| Raw engagement rate | How many visible actions occurred relative to the chosen denominator? | Distribution, audience mix, and downstream value | Low-impression posts can look unusually strong |
Normalize before you compare
For social publishing, normalize performance by both followers and views or impressions. Benchmark data shows why audience size matters. One benchmark set reported engagement falling from 4.84% for accounts with 1K to 5K followers to 0.76% for accounts with 1M or more followers, as detailed in this social media benchmark guide. The lesson isn't that smaller accounts always create better content. It is that raw likes and a single engagement rate don't support fair comparisons across account sizes.
Use normalized engagement per 1,000 impressions to compare exposure efficiency. Then inspect whether the actions were replies, shares, clicks, saves, or low-effort reactions. Each reveals a different kind of value.
Measure attention quality
For long-form posts, dwell time and read-through help separate a compelling argument from a headline that merely earns a click. In GA4, engaged sessions and average engagement time are more useful for content diagnosis than legacy session duration because GA4 defines engagement around active interaction, as explained in this GA4 engagement benchmark report. High views with low average engagement time often indicate a mismatch between the promise and the opening experience. High engagement time with low conversion suggests that the content held attention without directing it toward the next action.
Reply quality adds another layer. Score replies by substance, question density, and whether they produce follow-on threads. A post that attracts several thoughtful responses may be more useful than one that accumulates many easy agreements.
Engagement rate is a diagnostic starting point, not a forecast input.
Reading a 72-Hour Performance Replay Like a Practitioner
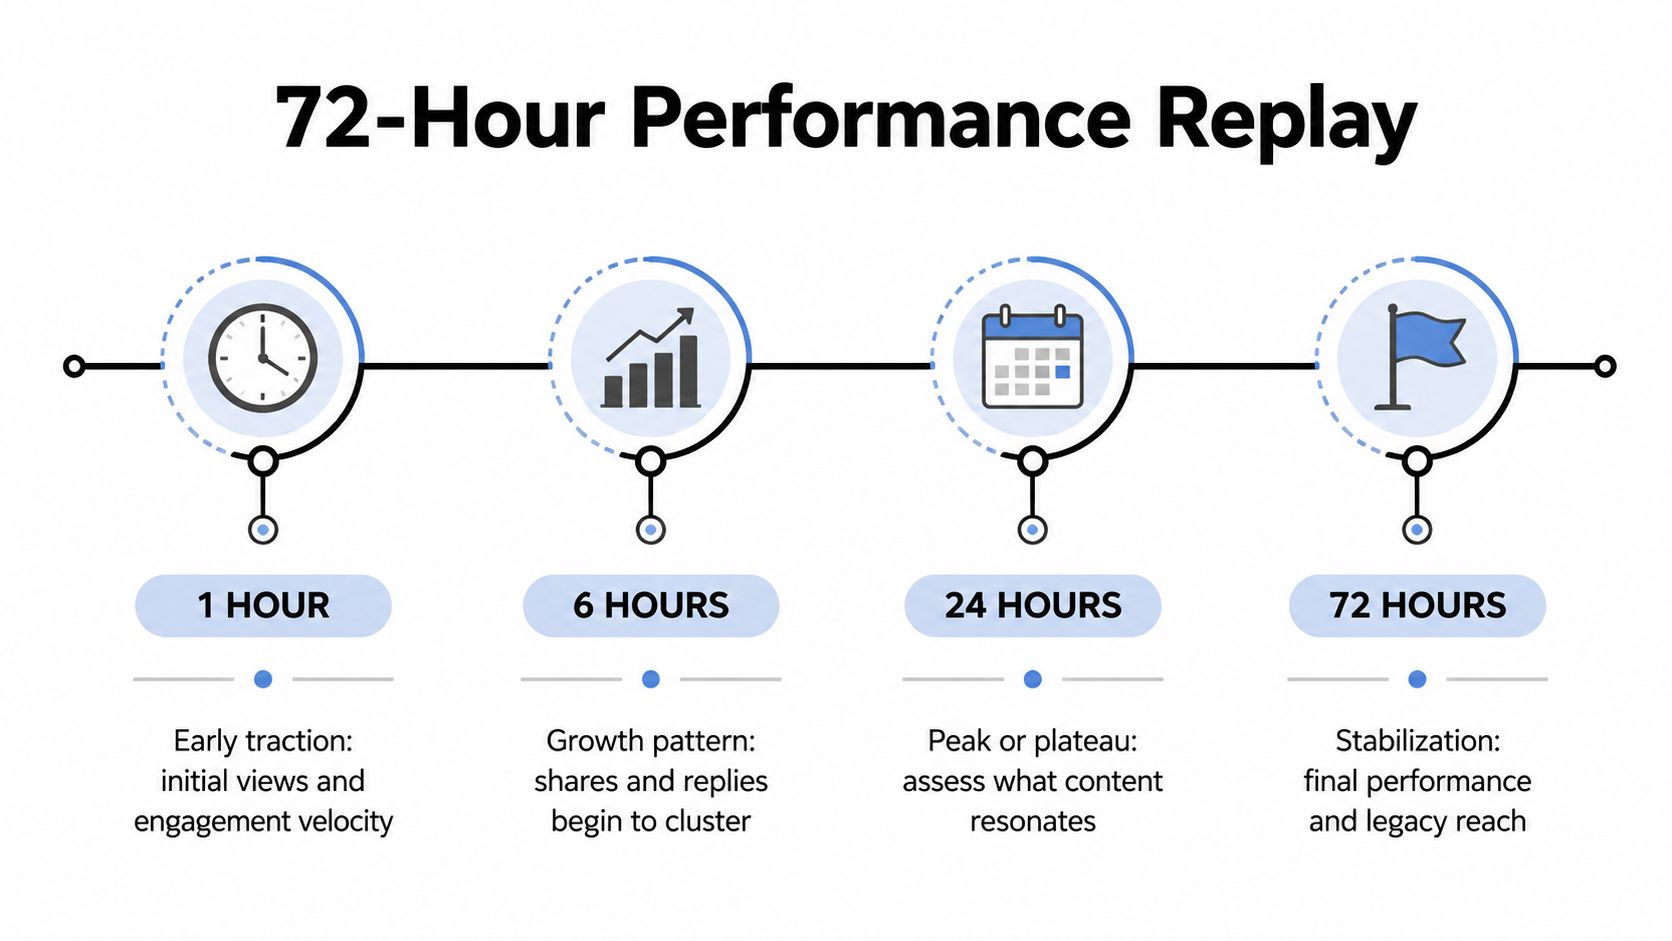
The first three days after publication reveal different parts of a post's behavior. Checking the dashboard only at the end hides the sequence. A replay preserves it, so you can distinguish early relevance from later durability.
The first hour
At the first checkpoint, look for early reply velocity and bookmark activity. These measures act as a relevance pulse. Replies show that the opening gave people a reason to participate, while bookmarks suggest that the idea may have utility beyond the immediate feed session.
Don't treat the first hour as a final verdict. Record the direction and quality of the response instead.
Calibration note: “The opening generated active responses quickly, but bookmark activity was weak. Next test, keep the subject and make the takeaway more reusable.”
The six-hour check
At six hours, compare measured reach with the pre-publish forecast range. If the post has overshot the upper bound, identify the public signal that may have been underestimated. If it has undershot the lower bound, inspect the hook, format, timing, and early conversation before blaming the topic.
A views-dropped performance guide can help frame the diagnosis, but the account's own forecast and replay remain the primary evidence.
| Checkpoint | Main signals | Decision |
|---|---|---|
| 1 hour | Reply velocity, bookmarks | Is the opening creating relevance? |
| 6 hours | Reach versus forecast range | Did distribution match the hypothesis? |
| 24 hours | Dwell time, profile visits | Did curiosity become intent? |
| 72 hours | Follows, repeat visits, citations | Did attention become durable value? |
The twenty-four-hour review
At 24 hours, layer in dwell time and profile visits. A post may attract people who read carefully but never inspect the account. That points to a positioning or call-to-action problem. Profile visits without follows suggest that the profile promise, pinned content, or perceived future value needs work.
Calibration note: “Attention quality was strong, but profile progression was weak. Next test, align the opening promise with the account bio and pinned post.”
The seventy-two-hour replay
At 72 hours, tally follower conversion, repeat visits, and downstream citations. The point isn't to produce a grand score. It's to determine whether the post created a continuing relationship or exhausted itself as a one-off event.
Calibration note: “Reach landed inside the forecast range, but follow conversion lagged. Next test, narrow the audience promise and make the next-post benefit explicit.”
A replay becomes valuable when every note changes a future choice. Without that final sentence, analytics remains observation. With it, the archive becomes a decision system.
Why Follow Conversion Beats Vanity Metrics Every Time
A post's visible popularity can be disconnected from account growth. Follow conversion, measured as viewers who become followers within a defined attribution window, connects exposure to a continuing audience relationship. That makes it more relevant to monetization, brand partnerships, newsletter growth, and future distribution than a reaction count alone.
Consider three ways vanity metrics mislead:
- A post can receive a large volume of likes from an audience that already follows the account. The number looks impressive, but net-new audience growth remains absent.
- A controversial thread can trend for a short period and still create unsubscribes or unfollows afterward. Attention rises while audience quality declines.
- A viral one-off can attract people who don't care about the account's core subject. Those new followers may respond weakly to later posts, lowering the quality of future conversations.
The surface metric isn't useless. It answers a narrower question than many creators assume.
The bridge from reach to compounding growth
Follow conversion tells you whether the post made a credible promise about future value. A reader follows because they expect another useful idea, a consistent point of view, or access to a community they want to join. If the post earns attention without making that promise clear, reach won't compound.
Repeat visits strengthen the diagnosis. Someone who returns to the profile or revisits related content has shown more sustained interest than someone who tapped a reaction once. Track both events alongside the follow delta, then evaluate whether the new audience continues to participate.
A useful follower quality score can weight new follows by subsequent engagement. It shouldn't replace direct business outcomes, and it shouldn't pretend that every follow has equal value. Its purpose is to distinguish a durable audience addition from a low-fit follower acquired through an isolated spike.
The best-performing post isn't necessarily the one with the most visible activity. It's the one that improves the account's future audience.
This contrarian view aligns with the broader measurement problem. Sprout Social's 2025 benchmarks analyzed more than 3 billion messages from over 1 million public profiles, while later research still found that likes, shares, and similar surface metrics are weak proxies for purchase intent, loyalty, or later-stage value, as summarized in this content performance statistics review. Data volume is increasing, but decision quality still depends on connecting attention to what happens next.
Turning Analytics into a Weekly Learning Habit
A sustainable system needs fewer numbers than most dashboards display. Track the signals that support a forecast, explain the outcome, and guide the next experiment. For a solo creator, the minimum set is predicted reach range, measured reach, replies, shares, clicks, follow delta, and profile revisits.
Set the week around three deliberate reviews.
Monday forecast pass
Choose three upcoming posts and score them before publishing. Record the expected reach range, format, opening strength, timing fit, and intended conversion event. Don't revise the forecast after seeing early performance. The value comes from preserving the original hypothesis.
Thursday or Friday replay
Run the 72-hour replay for posts published earlier in the week. Review the four checkpoints, then write one sentence that names the expectation, the result, and the next change. Keep the replay short enough that you'll repeat it.
Sunday calibration note
Place predicted reach, actual reach, follow conversion, and repeat-visit lift side by side. Look for a pattern across posts rather than celebrating one spike. A calibration note might say, “Short openings reached the expected range, but detailed threads produced stronger profile progression. Test the same topic with a shorter first post next week.”
Run one experiment at a time. Change the hook, posting window, thread length, or format, but don't change all four together. Otherwise, you won't know which variable produced the difference.
| Day | Action | Signals Tracked | Output |
|---|---|---|---|
| Monday | Score three drafts before publishing | Forecast range, format, hook, timing | Written hypothesis |
| Thursday or Friday | Replay shipped posts at each checkpoint | Reach, replies, shares, clicks, visits | Performance diagnosis |
| Sunday | Compare expected and actual outcomes | Follow delta, conversion, repeat visits | Calibration note and next test |
Use a lightweight spreadsheet, platform exports, or a publishing workspace. Yubook is one option for creators and teams that want draft analysis, an explainable forecast range, cross-platform publishing to X and Threads, and performance replay comparing predicted with actual results. Its creator learning workspace fits the same operating model, where forecasts and outcomes remain separate until the replay.
The habit that separates improving creators from dashboard collectors is simple: write the sentence. State what you expected, what happened, and what changes next time. That sentence turns content performance analytics into a compounding skill rather than another weekly report.
Use this week to build a small forecast log, record three upcoming posts, and replay each one at the one-hour, six-hour, 24-hour, and 72-hour checkpoints. If you want a workflow that connects draft signals, predicted reach, follower conversion, and post-publication replay, visit Yubook and apply the forecast-versus-outcome loop to your next publishing cycle.