Engagement Meaning Social Media Explained for Creators
Discover the true engagement meaning social media platforms use in 2026. Learn formulas, platform differences, and how to measure what actually drives growth.
Upkeep · 2026-09-11 · 47 min
Most creators are told to “improve engagement” as if engagement were a single score that can be raised through better hooks, more comments, or more frequent posting. That advice skips the question that determines whether the number means anything: engagement divided by what?
A post's interaction total can look impressive while hiding weak audience connection. The same percentage can represent different levels of performance when one platform uses followers as the denominator and another uses reach, views, or impressions. For creators building an audience on X, Threads, or any other network, the useful question isn't just whether people interacted. It's whether the interaction came from the right audience and led to profile visits, follows, conversations, clicks, or repeat attention.
Table of Contents
- Why Engagement Is Not One Universal Metric
- The Component Actions That Count
- Engagement Rate Formulas and When Each One Misleads
- Platform-Specific Mechanics for X and Threads
- Measurement Pitfalls and Vanity Metrics to Avoid
- Actionable Best Practices for Improving Engagement
- Interpreting Engagement Data for Better Publishing Decisions
Why Engagement Is Not One Universal Metric
Social media engagement is not a single score. It covers actions such as likes, comments, shares, saves, clicks, mentions, and direct messages, while the resulting rate depends on what those actions are divided by. Brandwatch's definition of social media engagement captures the action layer, but a dashboard's formula determines what the number can support.
A follower-based report, a reach-based report, a view-based video report, and an impression-based campaign report may all use the label “engagement rate.” Their percentages are not interchangeable. The denominator changes whether the result describes response from an existing audience, response among people who saw the post, or response relative to delivery volume.
The denominator is part of the metric, not a footnote.
A 5% engagement rate by followers means interactions were large relative to the account's follower base. A 5% engagement rate by reach means interactions were large relative to the people who received the content. The first can help assess audience activation. The second can help assess how content performed among exposed viewers. Neither is automatically better.
The number alone cannot tell you which audience responded or whether the response led to growth.
Why benchmark comparisons go wrong
Platform benchmarks make the mismatch visible. A 2026 benchmark review reported median engagement rates of 0.48% for Instagram, 0.15% for Facebook, 4.7% for LinkedIn pages, 6.25% for Threads, and 5.91% for YouTube Shorts, while the calculation method varied by platform context. Those figures should not be treated as a universal ranking.
A creator comparing a follower-based Instagram rate with a reach-based Threads rate may attribute the gap to audience quality. The formulas may explain much of it. Format, distribution, audience behavior, and the amount of content shown to non-followers also affect the result.
The historical shift in measurement adds context. Research published in 2021 described engagement as the number of people reached who then liked, commented, shared, or clicked a post, as documented in the academic study indexed by PubMed Central. That definition emphasizes observable response rather than exposure alone. Today, creators use engagement to evaluate resonance, format performance, distribution, and audience behavior, but those uses require consistent formulas.
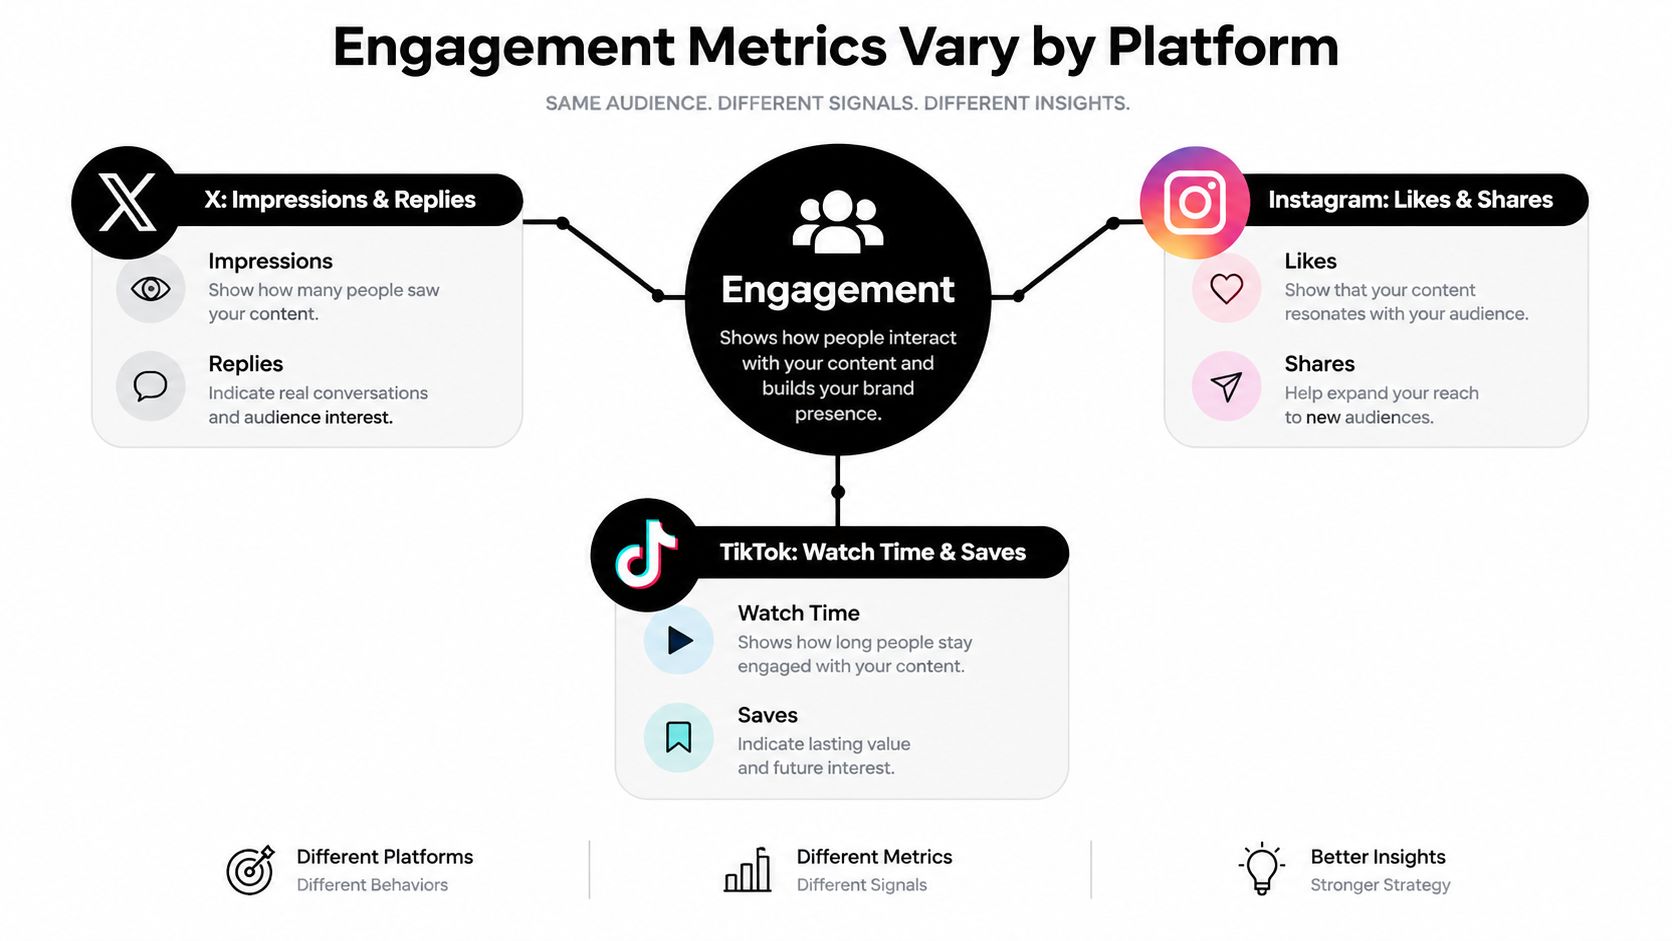
Treat engagement as a measurement family
Separate the dashboard into related measures:
- Exposure-based engagement: Interactions compared with reach or impressions.
- Audience-based engagement: Interactions compared with followers.
- Content-based engagement: Actions generated by one post or video.
- Intent-based engagement: Saves, shares, replies, clicks, and messages that indicate a stronger reason to act.
- Conversion-linked engagement: Interactions followed by profile visits, follows, return visits, or another defined outcome.
The useful question is not whether engagement is “good.” Ask which audience saw the content, which actions they took, and whether those actions predicted profile visits, follows, conversations, clicks, or repeat attention. That is how creators separate a comparable signal from a platform-specific percentage.
The Component Actions That Count
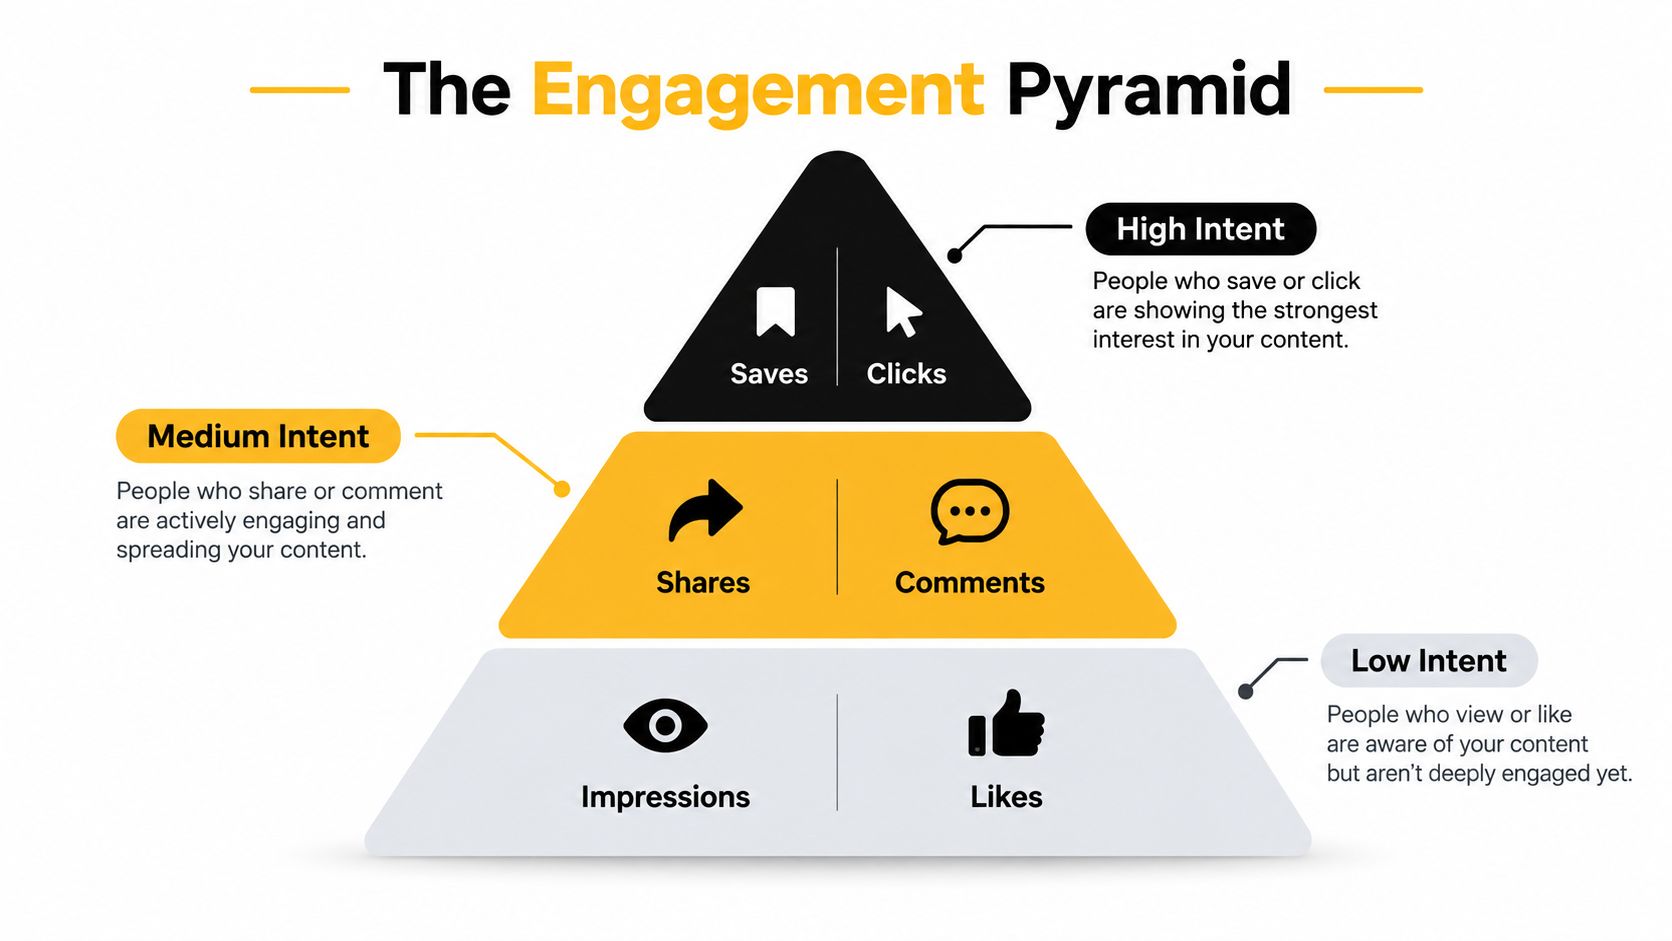
A single engagement total can make unlike behaviors look equivalent. That is a reporting convenience, not a reliable measure of intent. A like may reflect recognition, agreement, habit, or a quick reaction. A save, share, reply, direct message, or click usually requires a more deliberate choice. The same engagement number can therefore signal very different growth potential, depending on the platform's denominator and the action mix behind it.
The practical set includes likes, comments, shares, saves, clicks, mentions, and direct messages, as outlined in Brandwatch's explanation of engagement actions. Their value depends on the platform and the creator's objective. Use an intent hierarchy to examine what a post prompted, then compare those actions with profile visits, follows, or other defined outcomes.
Lower-friction signals
Impressions and views measure exposure rather than participation. They show that content was displayed or watched, but not whether viewers found it useful, persuasive, or worth sharing.
Likes and reactions indicate an active interface response, so they carry more information than exposure alone. They can help identify broad appeal, yet they provide limited evidence of learning, conversation, or future conversion without supporting actions.
A post with many likes may have earned quick approval while giving viewers no reason to visit the profile or follow the creator. Treat the count as an initial signal, not a conclusion.
Conversation and distribution signals
Comments and replies show participation, but raw volume hides quality. A thoughtful response that extends the topic provides stronger audience information than a series of generic reactions. Track whether replies introduce questions, objections, examples, or other signs that the post changed the conversation.
Shares and reposts show that the content has value beyond the original viewer. They can extend distribution while also indicating that the post fits the sharer's identity, interests, or social setting.
Mentions and user-generated contributions add a community dimension. They show people connecting the content to their own conversations or experiences, rather than responding only within the original post.
Higher-intent actions
Saves suggest future utility. Someone may save a checklist, explanation, resource, or opinion because they expect to return to it. Saves can identify evergreen content, although they do not prove a later visit or conversion.
Clicks express a clearer next step. They move someone from platform consumption toward a profile, site, newsletter, product, or another destination. Measure them separately from likes because entertaining content can attract reactions without producing meaningful traffic.
Direct messages often provide the richest context. A DM may reveal a question, objection, request, or buying signal that a public reaction cannot show. Messages also indicate which posts generate private discussion instead of visible engagement.
Dwell time belongs in the audit
Visible actions are only part of the response. Time spent reading or watching can indicate that the opening held attention long enough for the content to be processed, although measurement and availability vary by platform.
Match the action mix to the objective:
- Reach objective: Examine impressions, reach, shares, and reposts.
- Conversation objective: Examine replies, comments, mentions, and message quality.
- Authority objective: Examine saves, thoughtful responses, and repeat discussion.
- Conversion objective: Examine profile visits, clicks, follows, and return behavior.
Interaction volume describes activity, while interaction type helps explain intent. To estimate follower conversion, compare each action type with profile visits and follows rather than judging a headline engagement total alone.
Engagement Rate Formulas and When Each One Misleads
The same engagement total can describe very different performance. A post with 50 interactions might show strong response from people who saw it, weak response against a large follower base, or diluted activity after repeated displays. The denominator determines which question the metric answers. Hootsuite's formula guide lists followers, reach, impressions, and views as common bases for engagement-rate calculations.
| Formula | Best For | When It Misleads | Example Rate |
|---|---|---|---|
| Engagements ÷ followers | Comparing posts with the account's accumulated audience | It understates discovery among non-followers and can be distorted by inactive followers | A post with 50 engagements and 1,000 followers produces 5% |
| Engagements ÷ reach | Evaluating how people who received the post responded | A narrow audience can generate a high rate without showing scalable demand | A post with 50 engagements and 500 reached users produces 10% |
| Engagements ÷ impressions | Assessing response across repeated exposure, especially in paid distribution | Multiple displays to the same people dilute the rate, and impressions do not represent unique viewers | A post with 50 engagements and 2,000 impressions produces 2.5% |
These figures are arithmetic illustrations, not benchmarks. They show why a single post can look weak or strong when the denominator changes. A creator comparing follower-based rates with reach-based rates is measuring audience size in one case and response among exposed users in the other.
Follower-based rates
Follower-based engagement rate gives account-level comparisons a stable reference. It answers: how much activity did this post generate relative to the audience already attached to the account?
Distribution remains outside the calculation. Recommendation systems can show a post to many non-followers, while the denominator still reflects only existing followers. A modest rate may therefore accompany useful discovery. Compare it with non-follower reach, profile visits, and follows before judging the post.
Reach-based rates
Reach-based engagement rate is often more informative for organic content because it links actions to people who received the post. It separates distribution from response: reach shows how many unique accounts saw the content, while the rate indicates how many of those accounts acted.
Small samples create the main risk. A post shown to a narrow audience can produce a high rate without proving that the format will perform at broader scale. Keep absolute reach and audience composition beside the rate. For follower conversion, examine whether engaged viewers visited the profile and followed, rather than treating a high rate as proof of growth.
Impression-based rates
Impression-based engagement rate fits situations where repeated exposure matters, including paid distribution. It becomes misleading when impressions are treated as people. One user can create multiple impressions, so this denominator measures displayed opportunities, not unique audience size.
Choose one primary formula for trend analysis and keep the other rates as diagnostic views. Do not switch formulas because one produces a more flattering result. Use the formula that matches the distribution question, then compare engagement with profile visits and follows to identify the rate that predicts audience growth.
Platform-Specific Mechanics for X and Threads
X and Threads reward participation, but their audiences and distribution contexts aren't interchangeable. The available benchmark evidence shows a wide methodological spread across platforms, and Sociavault's 2026 benchmark discussion specifically highlights how rates can vary when reports use different denominators.

X favors conversational leverage
On X, independent creators often treat the original post as the entire distribution unit. That leaves attention on the table. A useful post can travel through replies, quotes, reposts, profile visits, and conversations with adjacent audiences.
Focus on four practical signals:
- Reply quality: Write prompts that invite a specific experience, disagreement, or extension rather than a generic “What do you think?”
- Quote potential: State a clear claim that another person can add context to without rewriting your entire argument.
- Dwell value: Use a strong opening and enough substance to reward reading, not just a short reaction.
- Audience borrowing: Participate in relevant discussions where your contribution stands alone and gives readers a reason to inspect your profile.
A reply chain can outperform an isolated broadcast because it places your ideas inside an existing conversation. That doesn't mean replying indiscriminately. Relevance, timing, and the usefulness of the contribution matter more than mechanical activity.
Creators can use X post and account checks to review visibility concerns and distinguish weak distribution from a post that isn't being surfaced normally.
The following video provides additional visual context for how a feed presents competing posts and interaction opportunities:
Threads favors a different comparison
The benchmark review cited earlier reported a 6.25% median engagement rate for Threads, but the figure should be compared only with rates calculated under compatible methods, as explained by Brandwatch's platform glossary. Threads' higher reported median doesn't prove that every creator should move their strategy there. It suggests that audience fit and measurement context deserve more attention than a universal platform ranking.
Use Threads to test ideas that benefit from open-ended discussion, concise observations, and accessible context. A post may attract interaction because it feels easy to join, not because it delivers the same depth or conversion intent as a specialized X thread.
The strategic distinction is this: X often rewards conversation embedded in a fast-moving public network, while Threads can provide a different environment for lightweight participation and discovery. Track replies and profile actions separately on both platforms. A higher interaction rate matters less if it produces fewer relevant followers or weaker repeat attention.
Measurement Pitfalls and Vanity Metrics to Avoid
Creators rarely make bad decisions because they lack data. They make them because they trust an attractive number without checking what it represents.
Follower count is a cumulative audience measure, not a current-content performance score. It can rise while recent posts receive little meaningful attention, or remain flat while a creator builds stronger relationships with a smaller, more relevant audience.
Total likes have the same problem. A raw count doesn't reveal reach, audience quality, content age, or whether anyone took a valuable next step. Compare likes with the denominator and with higher-intent actions before drawing conclusions.
The traps that distort strategy
- Viral-post averaging: One unusually distributed post can inflate an account's average engagement and make ordinary content look worse than it is.
- Follower accumulation: A larger follower base can conceal declining response from the people who regularly see your posts.
- Engagement pods: Coordinated interaction can increase visible activity without creating genuine interest, useful feedback, or lasting conversion.
- Follow-for-follow schemes: These tactics prioritize account counts over audience fit and can fill a profile with people who don't read, respond, or return.
- Platform chasing: A high reported median on one network doesn't mean that network contains the audience most likely to care about your subject or follow your work.
If an interaction doesn't improve reach quality, audience understanding, or conversion, treat it as evidence to inspect, not success to celebrate.
Build a less flattering dashboard
Track each post with its formula, format, topic, reach, total engagements, action mix, profile visits, follows, and relevant clicks. Keep public signals separate from measured outcomes. A post can receive strong public activity and still convert poorly, while a quieter post can attract the right readers.
Use this guide to diagnosing dropped views when distribution changes, but don't assume every decline reflects suppression. Content topic, timing, audience activity, format, and denominator choice can all change the apparent result.
The most useful comparison is often not “Which post got the most engagement?” It's “Which post produced the strongest chain from exposure to meaningful action to follower conversion?”
Actionable Best Practices for Improving Engagement
Improving engagement quality starts with reducing the distance between the reader's problem and the post's first useful idea. A clever hook can win attention, but only relevant substance earns saves, replies, shares, clicks, or follows.
Design the post around one response
Choose the response before writing. If you want discussion, present a tension and ask a bounded question. If you want saves, make the post referenceable. If you want profile visits, offer enough expertise to establish credibility while leaving a clear reason to explore related work.
Use a hook that makes a specific promise:
- Contrarian claim: Challenge advice your audience already hears.
- Observed pattern: Describe a recurring behavior and explain its consequence.
- Practical test: Give readers a decision they can apply immediately.
- Open question: Ask for experience or judgment, not a one-word reaction.
Don't attach multiple competing calls to action. A post asking for a like, comment, repost, click, and follow gives readers no clear priority.
Make conversation useful
Reply to early comments with information that changes the discussion. Add an example, clarify a limitation, or ask a narrower follow-up. The aim isn't to manufacture comment volume. It's to create a thread that a new reader can enter without needing the original context.
On X and Threads, reply targeting can also expand discovery when you contribute to conversations followed by people who care about your subject. Yubook can analyze drafts, provide an explainable forecast range, support cross-platform publishing to X and Threads, and connect attention with follower-conversion analytics. Use it as a measurement and planning option, not as a substitute for audience understanding.
Test one variable at a time
Change the opening while keeping the topic stable. Then test the format, question type, or publishing window separately. This makes the result interpretable.
Use audience timing guidance as a starting point, then compare actual outcomes against your own account history. Posting at a recommended time won't rescue a weak idea, and an excellent idea can perform outside a conventional window.
Optimize for the next valuable action, not the easiest action to trigger.
Interpreting Engagement Data for Better Publishing Decisions
A high engagement rate can support the wrong publishing decision. Review performance against the formula, denominator, platform, and action that mattered. Before publishing, record a prediction: discussion, saves, profile visits, new readers, or follower conversion. Afterward, compare results using the same formula and time window.
Group posts by topic, format, opening style, and intended action. Repeated behavior across publishing cycles matters more than an isolated winner. A post with fewer interactions can be more valuable if it attracts profile visits and follows from people who fit your target audience.
Use this review sequence:
- Classify the outcome: Did the post gain exposure, interaction, intent, or conversion?
- Inspect the action mix: Were interactions mainly likes, or did replies, shares, saves, clicks, and follows contribute?
- Check audience fit: Did engaged people resemble the readers you want to retain?
- Choose one next experiment: Keep the strongest element and change one variable.
- Update your expectation: Calibrate future forecasts instead of treating one result as a permanent benchmark.
Benchmark figures provide context only. Results from other platforms become misleading when their formulas or denominators differ from yours. Compare posts within the same platform first, then connect engagement to profile visits, follows, and retained audience. Those downstream actions show whether attention converted into growth.
Yubook helps creators and teams analyze drafts, forecast likely reach with uncertainty shown, publish to X and Threads, and compare predicted performance with actual results. Visit Yubook to connect engagement signals with follower conversion instead of optimizing for an isolated public number.