Follower Growth Rate: What It Means and How to Improve It
Learn what follower growth rate is, how to calculate it correctly, and the practical levers that move it on X and Threads — from profile visits
Upkeep · 2026-09-03 · 33 min
You can post consistently for weeks and still feel stuck. The schedule looks disciplined, the content looks active, replies are going out, and yet the follower number barely moves. That's the part most creators misread, because the problem usually isn't effort, it's the gap between attention and follow conversion.
Follower Growth Rate is the metric that exposes that gap. It tells you whether your account is turning visibility into audience, or just collecting passing visits that never become followers. If your X or Threads profile feels busy but flat, shadowban-style checks often matter less than tracing the actual path from post to profile to follow.
Table of Contents
- Why Your Follower Count Stalls Even When You Post Daily
- Defining Follower Growth Rate and the Core Formula
- The Funnel Behind the Number
- Realistic Growth Rate Benchmarks by Account Size
- Practical Levers That Move Follow Conversion
- Common Misreadings and the Vanity Metric Trap
- A Weekly Routine for Diagnosing and Improving Your Rate
Why Your Follower Count Stalls Even When You Post Daily
A writer ships five posts a week for a month, replies to every decent conversation, and still sees a flat line. That's not unusual. Daily posting can create the appearance of momentum without producing the one behavior that matters most, a visit that turns into a follow.
Start with the simplest diagnosis
If people are seeing your posts, but the follower total is stuck, the break is usually upstream. The content may be earning impressions, but the profile isn't converting enough of that attention into action. In plain terms, people are reading, scrolling, and leaving.
That's why Follower Growth Rate is more useful than posting cadence by itself. It shows whether your account is expanding relative to its current base, not just making noise. The metric helps you separate three very different situations, low reach, weak profile conversion, and normal churn.
A lot of creators jump straight to “post more.” That can help distribution, but it won't fix a profile that doesn't make a strong enough case to follow. If the avatar, bio, pinned post, and recent posts don't line up, you can get attention without gaining audience.
Practical rule: if impressions look healthy but follows stay flat, don't blame the calendar first. Check the profile path first.
A useful habit is to review where the stall appears before changing the whole content strategy. A simple when to post check only helps if the account already gives visitors a clear reason to stay.
Defining Follower Growth Rate and the Core Formula
Follower Growth Rate is the percentage increase in followers over a fixed period. The cleanest version of the formula is net new followers divided by starting followers, multiplied by 100. That makes it easy to compare accounts that start from very different sizes, which is why the metric is used so often in benchmarking.
How the formula works in practice
Use the period you care about, then count the starting follower total and the ending total. Subtract unfollows from gains, because the rate should measure net movement, not gross activity. That distinction matters, since a busy account can gain a lot and still end the period with only modest net growth.
Here's a worked example. A creator starts the month with 8,400 followers, gains 720, loses 80, and ends at 9,040. Net new followers are 640, and 640 divided by 8,400 gives roughly 7.6% monthly growth.
| Window | Formula | Example Numbers | Result |
|---|---|---|---|
| Weekly | Net new followers ÷ starting followers × 100 | 48 net new ÷ 1,200 start | 4% |
| Monthly | Net new followers ÷ starting followers × 100 | 640 net new ÷ 8,400 start | 7.6% |
| Daily | Net new followers ÷ starting followers × 100 | 12 net new ÷ 3,000 start | 0.4% |
Which time window to use
Monthly is the safest default for stable accounts, because it smooths out day-to-day swings. Weekly is useful when the account posts often and the traffic pattern is active enough to show meaningful change. Daily only makes sense during a viral spike or a short campaign window, because it's too noisy for normal benchmarking.
Treat the rate as a momentum indicator, not a complete health score. A high count without growth can still be a weak account, while a small account with steady rate can be in a much stronger position to compound.
The Funnel Behind the Number
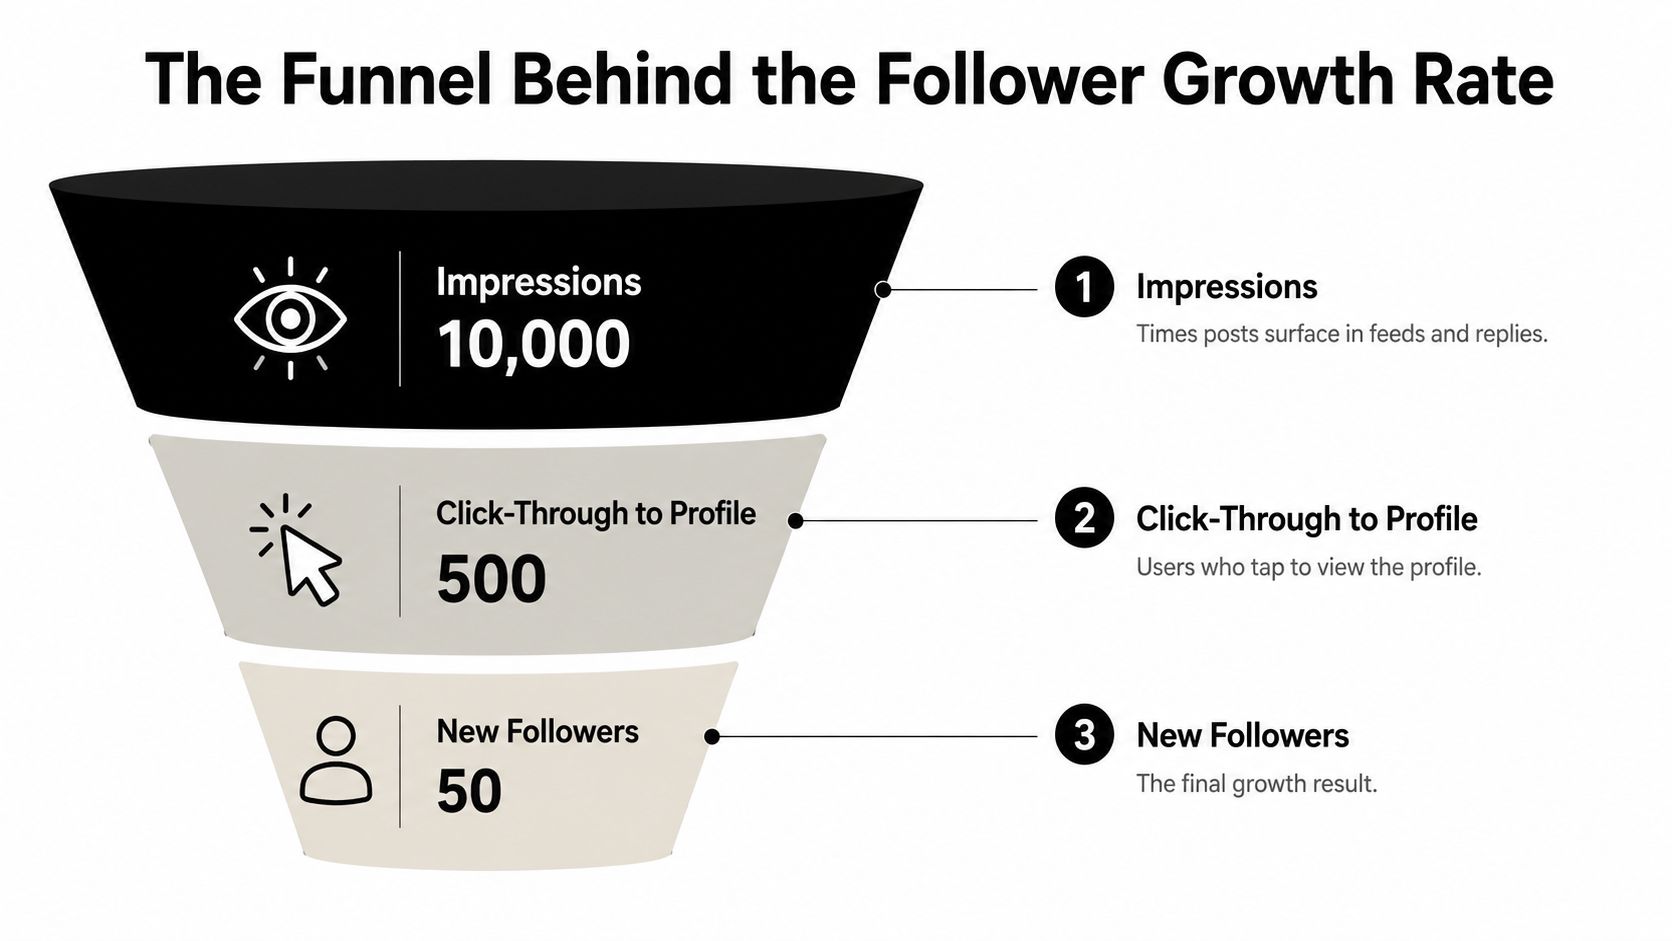
The growth result is not magic. It's the final output of a small funnel that starts with visibility and ends with a decision to follow. If one stage underperforms, the whole number drops.
Four stages decide the outcome
First comes impressions, which are the times your posts surface in feeds, replies, or search surfaces. Then comes click-through to profile, which is the share of viewers who tap through to check who you are. After that comes follow conversion, the share of profile visitors who hit Follow.
The last stage is repeat visits. People often need more than one touch before they follow, especially on X and Threads, where readers skim quickly and return after seeing you again in replies. That second visit can matter more than the first because familiarity lowers friction.
You can think of the math as a simple chain. If impressions rise but profile clicks stay low, the funnel narrows. If profile clicks rise but follow conversion is weak, the bio and pinned post are doing too little work. If repeat visits are thin, you're not building enough recognition for people to feel safe following.
Practical insight: the growth rate usually breaks at the first weak stage, not at the last visible one.
Native analytics on X and Threads can show parts of this path, but not all of it in one place. Profile visits are easy to spot, while conversion between visits and follows often needs a cleaner export or a dedicated growth tool to read properly. That's where the upstream funnel becomes more useful than raw follower totals, because it tells you which stage needs repair.
Realistic Growth Rate Benchmarks by Account Size
Benchmarks only help when you compare like with like. A small account and a large account do not grow inside the same conditions, and platform behavior matters as much as size. A benchmark report from industry benchmark report shows that X/Twitter accounts in the 1K to 5K range can see 1% to 4% monthly growth, while 500K to 1M accounts typically sit around 0.1% to 0.5% monthly growth.
Where the platforms differ
Threads can move faster at smaller sizes. The same benchmark source places Threads at 8% to 18% monthly growth for 1K to 5K accounts, then 1% to 3% monthly growth for 500K to 1M accounts. That gap matters because audience size changes the expected pace, even when creator quality is similar.
A separate benchmark set shows broader platform differences too. It reports TikTok with more than 200% year-over-year follower growth, while Instagram is at 1.37%, LinkedIn at 0.85%, and Facebook at 14.53% for the measured period (platform benchmark set). A “good” growth rate depends heavily on the platform you are measuring.
| Account Size | X Monthly Growth Rate | Threads Monthly Growth Rate | Notes |
|---|---|---|---|
| 0–1K | Qualitatively higher than mature accounts | Qualitatively higher than mature accounts | New accounts can move quickly if profile fit is clear |
| 1K–10K | 1% to 4% in the 1K to 5K band, per benchmark data | 8% to 18% in the 1K to 5K band, per benchmark data | Early-stage growth is often proportional |
| 10K–100K | Low single digits are common for mature accounts (benchmark guidance) | Low single digits are common for mature accounts | Momentum depends on content fit and reply quality |
| 100K+ | 0.1% to 0.5% in the 500K to 1M band, per benchmark data | 1% to 3% in the 500K to 1M band, per benchmark data | Large audiences convert more slowly proportionally |
Don't confuse benchmarks with goals
A viral post can push the rate far above its normal band. A follow-back surge after an event can do the same, and so can an influx of low-quality followers that will not stay engaged. Those spikes can make an account look healthier than it really is.
Use the ranges as a diagnostic baseline. They answer a simple question, “Is this normal for this size and platform?” Treat the rate as a momentum indicator alongside a fuller health check, then decide whether the problem sits in content, distribution, or profile conversion.
Practical Levers That Move Follow Conversion
Profile visits do not become followers automatically. Conversion is where growth is won or lost, and the profile page is usually where the decision happens. On X and Threads, people often decide in a few seconds whether your account feels worth following.
What to test first
Start with bio clarity. A visitor should know who the account is for, what kind of value it delivers, and why the follow matters. If the bio sounds broad or clever but vague, the follow decision gets delayed.
Next, use the pinned post as a proof point. It should show the best work, the clearest promise, or the most representative thread. The header image should reinforce the same positioning instead of introducing a new idea.
Recent posts matter too, because visitors often look at the latest visible items before they commit. If the top of the feed is inconsistent, the account feels unstable. If the recent work matches the bio promise, the profile feels coherent.
Run one clean test at a time
Try a one-week A/B-style change by rewriting the bio for clarity, then watch the profile-visit-to-follow ratio in your analytics. Keep the content style steady while you test the profile itself, or you won't know what caused the shift. If the ratio improves, the profile message is doing more work.
A second test is the follow trigger inside your content. Phrases like “follow for weekly X breakdowns” or “follow for Threads publishing notes” can help when they match the actual output. The key is consistency between the promise and the feed.
The profile has to answer one question quickly, why should this person stay?
Tools that surface visitor-to-follow behavior can shorten the diagnostic loop, including Yubook, which links profile visits to follow conversion and repeat visits. Used correctly, that kind of view helps separate profile-side conversion from feed-side conversion, which need different fixes.
Common Misreadings and the Vanity Metric Trap
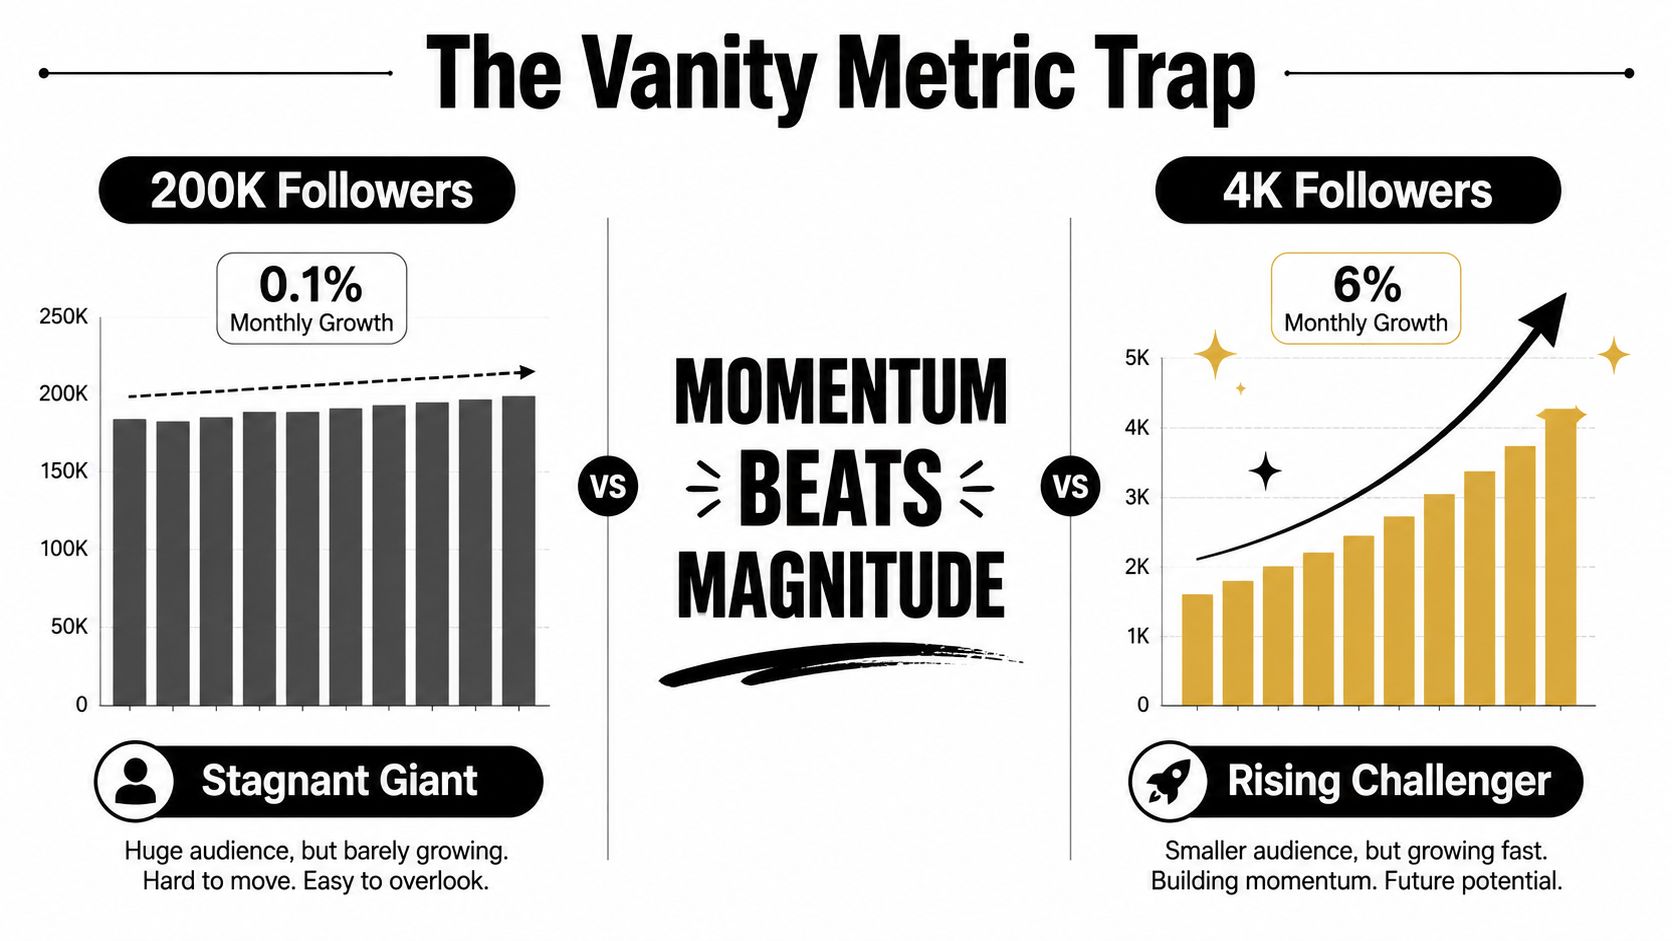
A bigger follower count can look impressive while the account is barely moving. That is the vanity trap. 4K followers growing at 6% monthly has stronger momentum than 200K followers growing at 0.1% monthly, even though the larger number looks better on a slide.
The common mistakes
One mistake is mixing up net follower change with growth rate. Net change tells you the absolute number added or lost, while growth rate puts that movement against the starting base. Without the rate, size distorts the picture.
Another mistake is ignoring churn. If a creator gains fast but also loses fast, the net growth can stay flat. A third is treating a one-day viral spike as a stable trend, when it may just be a temporary surge in attention. If the spike comes from a sharp drop in views after the post peaks, the pattern behind views dropping is usually upstream from follower growth, not in the follower count itself.
Purchased followers and follow-trading create another illusion. They can lift the count without creating meaningful audience behavior, which means the visible number rises while real momentum stays weak. A rate anchored in net movement is harder to fake than a raw total.
The broader point is simple. Rate is the better leading indicator because it captures compounding early, surfaces traction faster, and shows when an audience is expanding. Raw count only tells you where you are now, not whether the account is gaining real pull.
Rule of thumb: if the count is rising but the rate is flat, the account may be adding weight without adding momentum.
A Weekly Routine for Diagnosing and Improving Your Rate
A weekly check is enough to catch most growth problems before they become habits. Start on Monday by pulling the starting followers, ending followers, and net new followers from the last seven days. Plug those numbers into the growth formula, then compare the result to the benchmark band for your account size and platform.
Use the same fields every week
Log profile visits, follow taps, and the top-performing post from the same period. Those fields show where the funnel widened or narrowed, which is more useful than staring at the follower total alone. If the top post earned traffic but not follows, the issue is probably profile conversion. If the post didn't earn traffic at all, the issue is earlier in the funnel.
Your weekly cadence can look like this:
- Monday: Pull net new followers and starting/ending totals.
- Tuesday: Calculate the weekly growth rate.
- Wednesday: Compare it against your platform and size band.
- Thursday: Identify the weakest funnel stage.
- Friday: Pick one lever to test.
- Saturday: Review the top post and profile behavior.
- Sunday: Reset the notes and prepare the next week.
Think in four-week patterns, not one-off spikes
One week can lie to you. Four to six weeks usually won't. If the rate trends upward while profile visits and follow conversion both improve, the system is working. If the rate only rises when one lucky post hits, you're still dependent on luck instead of process.
That is the value of Follower Growth Rate. It turns growth into something you can inspect, compare, and improve without guessing which part of the funnel broke first.
If you want a clearer way to track follower growth, profile visits, and follow conversion without guessing, visit Yubook. It's built to help creators and teams on X and Threads connect publishing signals to audience growth, so you can see which posts, profiles, and follow patterns move the rate.