Forecasting Techniques for Social Reach That Actually Work
Learn forecasting techniques that turn social reach predictions into probability ranges you can trust. Practical guide for creators using X and Threads.
Upkeep · 2026-09-05 · 33 min
You're staring at a post that feels sharp, maybe even inevitable, and the draft tool hands you one tidy number anyway. It says your reach will be this much, as if distribution were a receipt instead of a moving target shaped by timing, replies, reshares, reader attention, and whatever the platform decides to amplify next. That's where most creators get trapped, because a single prediction looks decisive even when it hides the only things that matter.
Forecasting techniques are useful when they teach you how to read uncertainty, not when they pretend uncertainty doesn't exist. For social reach, the job is to understand the range around a post, what pushes it toward the lower end, what gives it room to climb, and how to compare the forecast with what happened later. Once you learn to read a forecast as a band of possibilities, you stop treating prediction as magic and start treating it as a literacy skill.
Table of Contents
- The Draft That Refused to Be a Single Number
- What Probabilistic Forecasting Means
- Signal-Based Forecasts and Public Platform Weights
- Comparing Point Predictions, Ensembles, and Probability Ranges
- A Social Post Reach Example From Draft to Replay
- The Confidence Gap and Why Uncertainty Framing Matters
- A Creator Forecasting Checklist You Can Reuse Every Week
The Draft That Refused to Be a Single Number
A creator opens a thread draft, tightens the hook, and adds a reply prompt at the end. The preview panel answers with a neat label, something like “predicted reach: 4,200,” and that number feels comforting because it looks finished. It also feels wrong, because the creator can already see the gaps the number ignores, the post's opening strength, whether replies will stack, whether readers will linger, and whether a topic already saturated the feed.
That's the problem with a single point prediction. It collapses a messy social system into one integer, then asks you to trust all the hidden assumptions behind it. A useful forecast doesn't just announce a likely outcome, it shows a likely floor, a probable band, and the conditions that could move the post higher or lower.
Why the integer is the wrong unit of trust
A tidy number answers the wrong question. Creators don't just need to know what might happen, they need to know how much uncertainty sits inside the estimate and whether the post can still justify the time it took to make. A range tells you more directly whether the draft is a safe bet, a stretch play, or a post that needs revision before it goes live.
Practical rule: if a forecast can't show its uncertainty, treat it as a rough guess, not a planning tool.
That shift matters because forecasting techniques aren't there to flatter the draft. They're there to help you decide whether to publish now, revise the hook, or save the idea for a better window. A creator who can read ranges can plan production, pacing, and expectations without confusing optimism with evidence.
What Probabilistic Forecasting Means
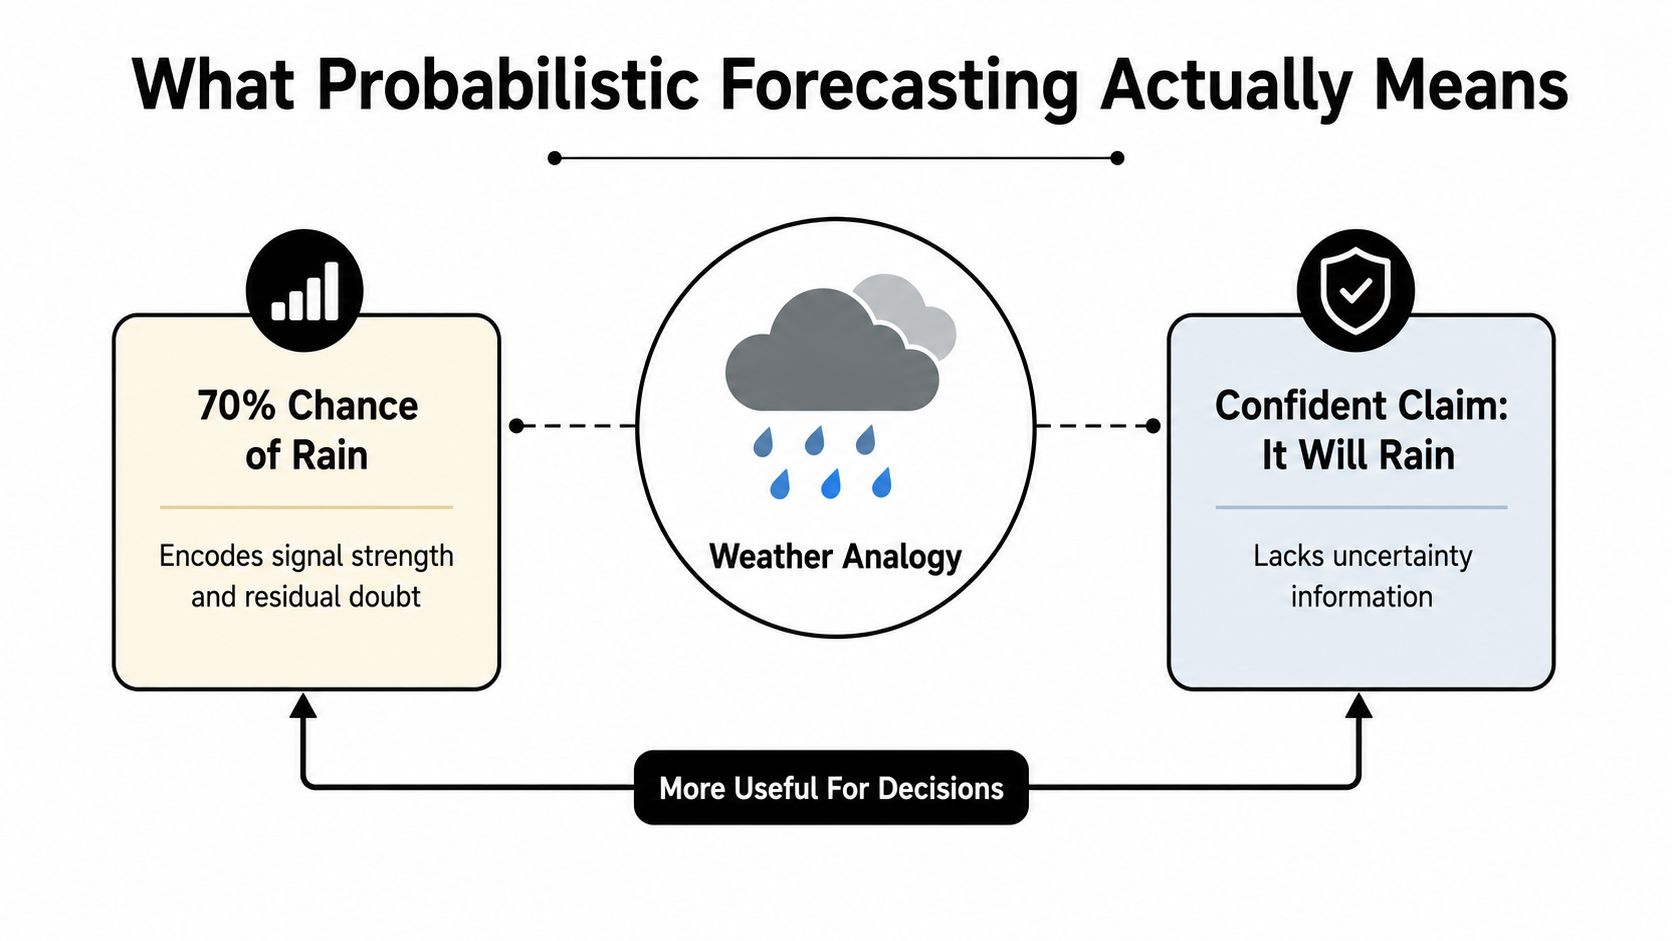
Probabilistic forecasting speaks in chances, not certainties. A weather forecast that says 70% chance of rain gives you more decision value than a flat “it will rain,” because it shows both the strength of the signal and the room left for error.
That same reading discipline helps creators judge social reach. A forecast that places a post at 1,800 to 3,400 impressions with 70% confidence is more useful than a single “expected” number, because it tells you where the outcome is likely to sit without pretending the result is fixed.
Point estimates and intervals are not the same thing
A point estimate gives one value. A prediction interval gives a range with stated confidence. A model can produce both, but they answer different questions, and creators often blur the line between them.
A single number can feel like a promise. A range is closer to a weather map, it shows where the post is likely to land and where the uncertainty still lives. That matters because a creator can then ask a practical question, whether the post still makes sense if it ends up near the lower bound, instead of treating the draft as if one outcome were guaranteed.
Calibration is the part people skip
A forecast only earns trust when its confidence claims hold up across many similar cases. Calibration means a band labeled “70%” should contain the outcome about 70 times out of 100 when you compare similar posts. If it does not, the forecast is wearing confidence it has not earned.
A forecast can sound precise and still mislead a good creator if it is not calibrated.
Reading forecasting techniques well is less about chasing a perfect hit rate and more about checking whether the model's confidence matches reality. For creators, that is the literacy skill that matters, learning how to read the range without overselling precision.
Signal-Based Forecasts and Public Platform Weights
Strong social forecasts start with signals the platform itself can observe. Reply behavior, share behavior, reading behavior, and negative-feedback cues tell you how a draft is likely to travel once it is live. The useful shift is to treat those signals as readable inputs, not as a promise of exact reach.
Reply velocity points to conversation depth. Reshare and quote-post rate point to amplification. Dwell time and read-through point to whether the system keeps extending distribution. Negative-feedback cues such as show less, mute, and block point to a ceiling.
Public signals are better than private hunches
Creators often overweight tone and underweight structure. A sharp opening can still underperform if it does not generate enough reply energy, and a thoughtful post can stall if readers bounce before the key point lands. Signal-based forecasting techniques score the draft on the same axes the distribution system appears to care about, so revision is tied to observable cues instead of vibes.
That does not make the public signals a hidden oracle. It makes them a checklist that can be tested, revised, and replayed after publication. When you separate public weights from actual outcomes, the forecast stays auditable. If you want to check posting context before publishing, when to post is a practical place to start.
| Public Platform Signals and What They Predict | ||
|---|---|---|
| Signal | Reach Outcome Predicted | Creator-Observable Cue |
| Reply velocity | Conversation depth and secondary visibility | Early reply count and reply quality |
| Reshare and quote-post rate | Amplification beyond the first audience | Shares, quote posts, and repost momentum |
| Dwell time and read-through | Whether distribution extends after the first scan | Time spent on the post and completion behavior |
| Negative-feedback cues | Where reach may cap out | Show less, mute, and block signals |
Read this table like a field guide. The point is not to guess harder. It is to use public signals as a scoring language that creators can understand, question, and refine after they see what the post replayed into.
Comparing Point Predictions, Ensembles, and Probability Ranges
A point forecast is the simplest version of the game. It hands you one number, hides the assumptions, and makes the output look cleaner than the process behind it. That simplicity is attractive, but it's brittle when the post behaves differently from past content.
An ensemble takes a different route. It combines several models or variants, then aggregates their estimates so no single assumption has to carry the full load. In the evidence-based forecasting literature, combining forecasts can reduce error by about 12%, which is a reminder that diversity in method often beats complexity inside one model Findings from Evidence-Based Forecasting.
What each method does well
The practical question isn't which method sounds smartest. It's which one stays useful when the post is unusual. A point forecast may be fast, but it can miss the shape of uncertainty. An ensemble may reduce variance, but it still needs calibration. A probability range says less about certainty and more about decision quality, which is often exactly what a creator needs.
| Forecasting Methods Compared | ||||
|---|---|---|---|---|
| Method | Typical output | Main strength | Main limitation | Best test |
| Point forecast | One reach number | Easy to read | Brittle when assumptions shift | Out-of-sample error |
| Ensemble forecast | Combined estimate from several models | Can reduce error by blending methods | Can still hide uncertainty if only one score is shown | Stability across unusual posts |
| Probabilistic range | Reach band with confidence level | Makes risk visible | Harder to read at a glance | Calibration over many posts |
Why calibration matters more than vanity accuracy
A model can be close once and still be unreliable. Forecasting technique only earns trust when its confidence bands behave consistently over many posts, not when one lucky prediction looks dramatic in a dashboard. That's why the better benchmark is, “Does this method stay dependable when the post is odd, timely, or unexpectedly shareable?”
Use the method that makes your uncertainty visible. A cleaner dashboard is not the same thing as a better forecast.
That idea matters for creators because the best forecast isn't the one that flatters the draft. It's the one that tells you whether your range is stable enough to plan around.
A Social Post Reach Example From Draft to Replay
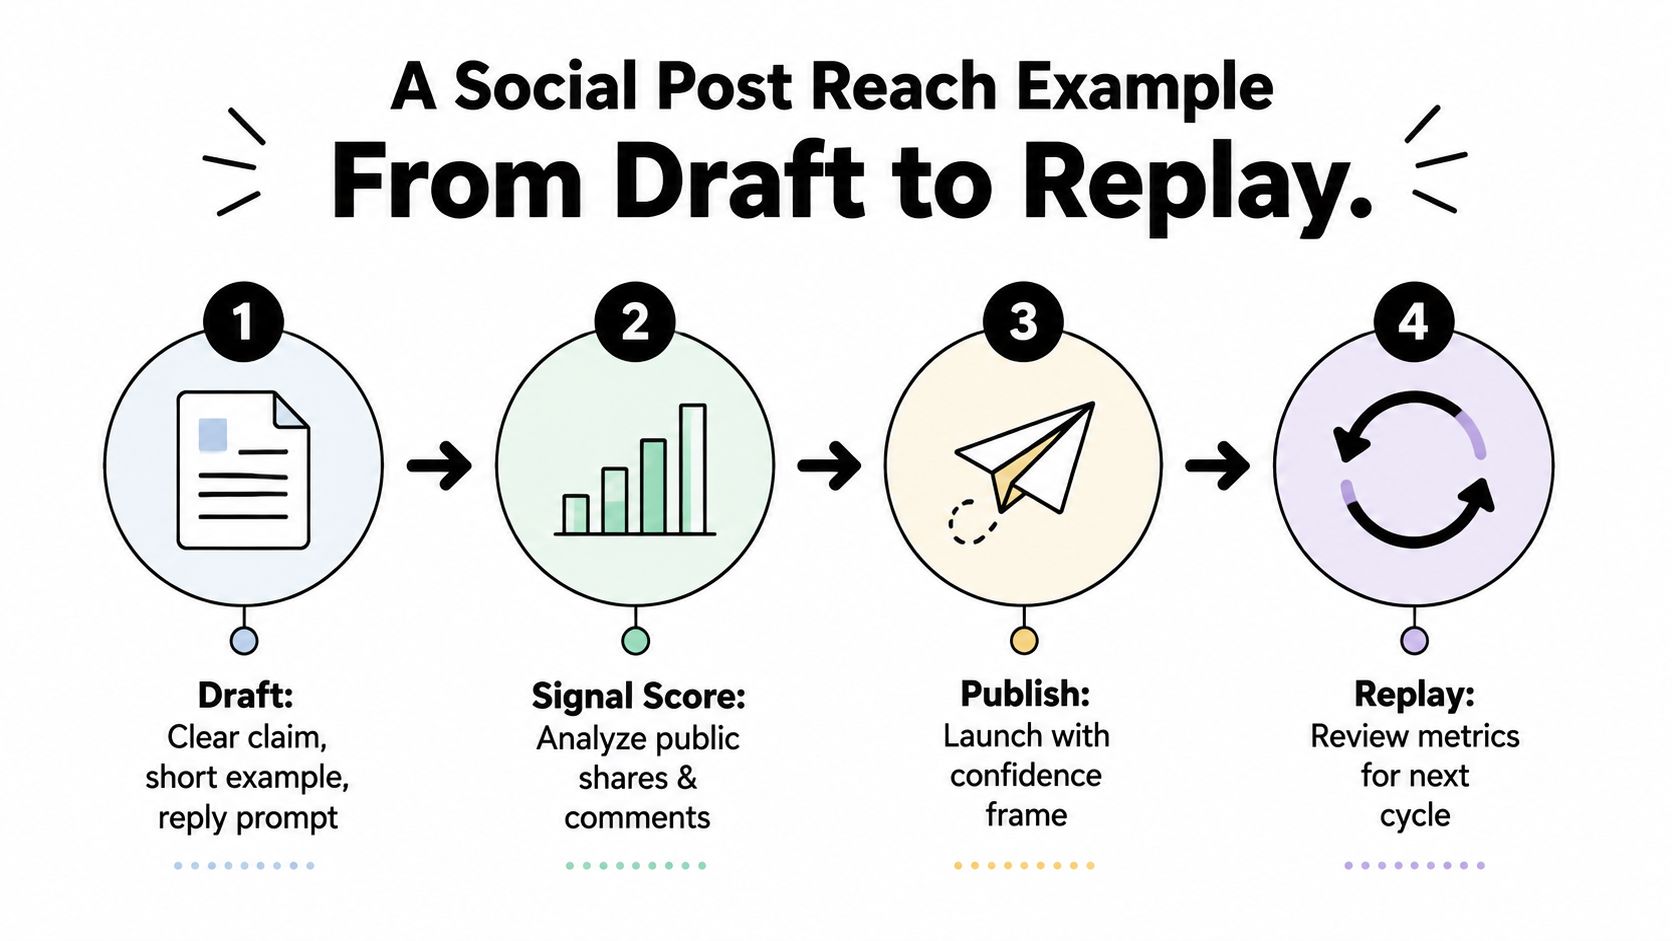
A creator writes a post with one clear claim, one short example, and one reply prompt. Before publishing, the draft gets scored against public signals, not against a private reach guess. The checklist includes topic relevance, account activity, posting-time context, opening clarity, likely dwell, reply potential, shareability, and possible negative feedback.
That separation is important. Public platform weights stay as weights, measured outcomes stay as outcomes, and the model never turns its own assumptions into facts. If you blur that line, the forecast starts grading itself.
After the post goes live, the creator checks performance at fixed points across the first 72 hours, then stores the result as a replay. If the actual reach lands inside the forecast band often enough, the range stays intact. If it keeps missing, the next forecast changes only after the replay shows which signals were weak, absent, or overcounted.
A simple replay loop
- Draft. Write the claim, the example, and the reply prompt.
- Signal score. Judge the post against public shares, comments, dwell cues, and negative feedback.
- Publish. Launch with a confidence frame, not a promise.
- Replay. Compare predicted range to actual reach and tag the outcome for the next cycle.
That loop is where forecasting techniques become useful in practice. The replay teaches the next draft what the previous one didn't know, and the next forecast gets tighter only when the evidence supports it.
If a post's view curve drops earlier than expected, this internal note can help you diagnose that pattern, views dropped. The point of the replay isn't to protect the model. It's to protect the creator from repeating a weak assumption.
The Confidence Gap and Why Uncertainty Framing Matters
A forecast can be numerically close and still be bad guidance. That's the confidence gap, the distance between being right on average and helping a person understand what the model knows. The more a forecast hides its uncertainty, the easier it is to misuse.
Many creators get misled. A line like “10,000 impressions” sounds firmer than “a 70% chance of reaching 8,000 to 12,000 accounts,” even though the second version is more useful for planning. The first invites overconfidence. The second forces a real question, whether the time, effort, and production cost still make sense if the post lands near the lower edge of the band.
Accuracy and confidence are different jobs
The difference matters because a forecast can be close without being legible. A creator needs to know not just whether the model was right, but whether the model made its ignorance visible. That's what confidence framing does, it turns uncertainty into something you can act on instead of something the dashboard hides.
Read the band as a decision aid, not a promise.
Uncertainty framing also helps separate three things that often get mixed together, model uncertainty, signal uncertainty, and real-world change. Missing public weights widen the range. Unusual audience behavior widens the range. Platform shifts widen the range. If the forecast doesn't say that plainly, it's asking for more trust than it has earned.
The Met Office's 2026 confidence-gap findings show how trust can lag behind model claims when people don't know how to read the uncertainty itself Met Office confidence gap study. Creators run into the same issue when they confuse a good estimate with a useful one.
A Creator Forecasting Checklist You Can Reuse Every Week
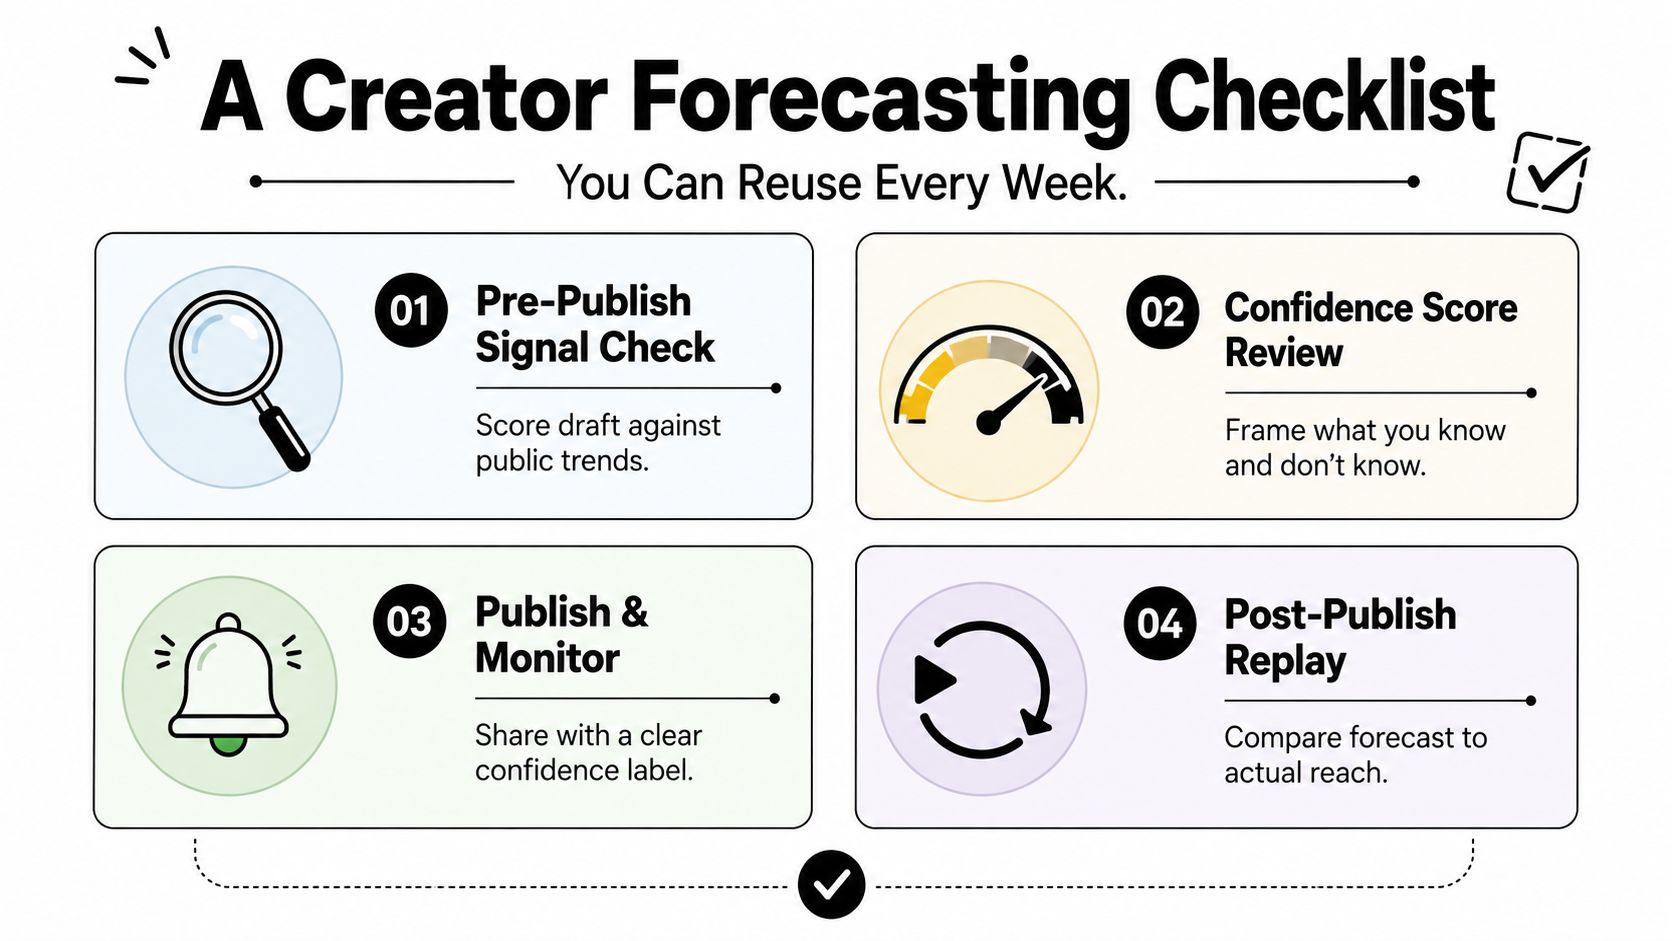
The cleanest forecasting workflow is a habit, not a special project. Start by scoring the draft against public platform weights before you publish, then write down an explicit probability range instead of a single reach number. That keeps the forecast honest before the post ever enters the feed.
Four habits that compound
- Pre-publish signal check. Score the draft against public trends, reply cues, shareability, and likely negative feedback.
- Confidence score review. Write the range and the uncertainty level in plain language so you know what's inside it.
- Publish and monitor. Launch with a confidence label, then watch the early response without rewriting the forecast midstream.
- Post-publish replay. Compare the band to actual reach, tag the result, and use that evidence to recalibrate the next draft.
When creators use this loop consistently, forecasting stops being guesswork and starts becoming a feedback system they own. The win isn't a perfect score, it's compound literacy, the ability to read ranges better every week and to spot when a signal stops earning its place.
If you want a publishing workflow that keeps public signals separate from measured results, Yubook gives creators a way to review drafts, forecast likely reach, and replay the outcome after publication. It fits this topic because it treats forecasting as a learning loop, not a vanity number. Visit it if you want to turn your next post into a clearer forecast and a cleaner replay.