How to Analyze Tweets for Real Publishing Results
Learn how to analyze tweets with a clear workflow that turns posts into measurable audience growth on X and Threads.
Upkeep · 2026-09-14 · 50 min
Most advice on how to analyze tweets starts in the wrong place. It tells you to open analytics after publishing, sort by likes, and explain why the top post won. That's reporting, not analysis. By then, the only thing you can change is your interpretation of a decision you've already made.
A useful workflow starts before publishing. You inspect a draft, make a forecast, choose the signal that matters for the objective, publish under a defined context, and compare the prediction with measured outcomes. X provides post-level signals such as impressions, engagements, clicks, replies, reposts, and follower changes, while native analytics commonly summarizes recent activity and lets you inspect individual posts through audience, content, and campaign views (Socialinsider's overview of Twitter analytics). The point isn't to collect every number. It's to use the right numbers to decide what you'll write, test, or schedule next.
Table of Contents
- Why Tweet Analysis Matters More Than Tweet Metrics
- Defining Objectives and Choosing the Right KPIs
- Collecting and Cleaning Tweet Data Without Bias
- Computing Engagement and Audience-Conversion Metrics
- Interpreting Content, Timing, and Network Signals
- Running Experiments and A/B Tests on Real Drafts
- Tools, Dashboards, and Forecasts That Close the Loop
Why Tweet Analysis Matters More Than Tweet Metrics
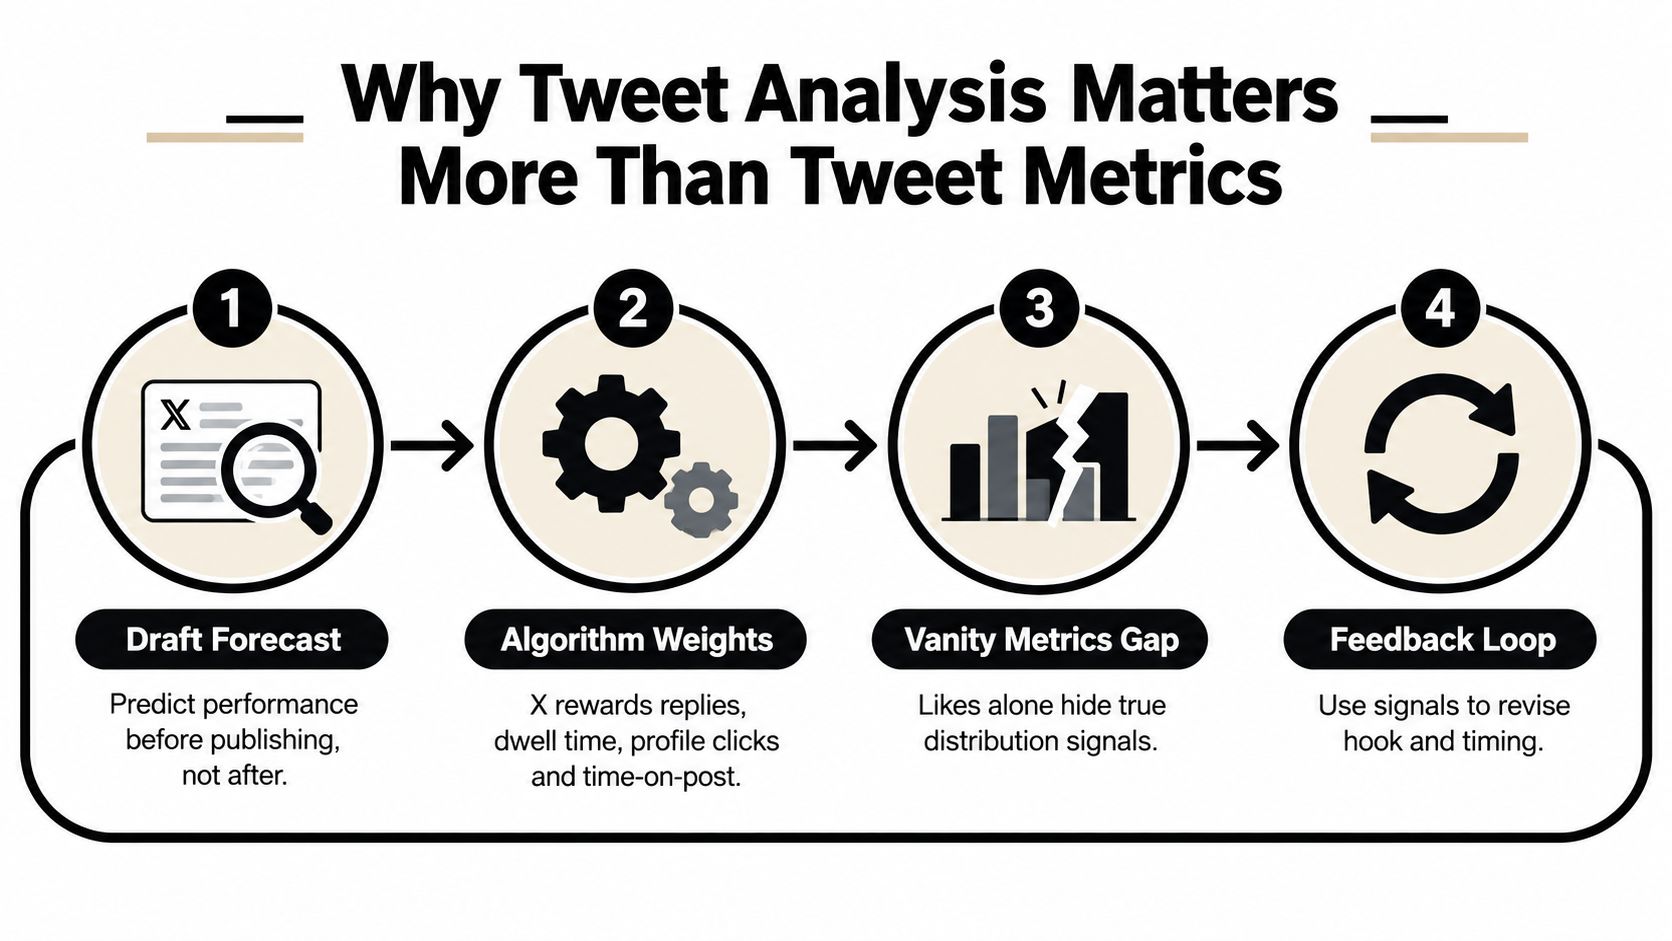
Two tweets can share nearly the same idea and still produce different business outcomes. One may earn more impressions because its opening is broadly recognizable, while the other earns fewer impressions but attracts replies from people who are likely to follow, click, or return. If you celebrate the larger reach without checking profile visits, reply quality, and follows, you may copy the weaker draft.
That's the central mistake in metric-first publishing. Creators often track likes, follower changes, and impressions because those figures are visible and easy to compare. But a publishing decision depends on deeper behavior, including whether readers stop to read, open a profile, reply with substance, repost to a relevant audience, or click through to the next step. Public platform signals can help you form a hypothesis, but they don't reveal an official ranking score. Your measured outcomes must remain separate from your assumptions about what X values.
Use analysis before the post goes live
Start with the draft, not the dashboard. Ask what action the opening invites, which reader should care, and whether the body earns a reply or merely asks for attention. Then record a forecast in plain language:
- Expected distribution: Will the idea earn broad exposure or mainly reach an existing niche?
- Expected response: Will readers reply, repost, click, visit the profile, or scroll?
- Expected conversion: What should happen after attention arrives?
- Main uncertainty: Is the risk in the hook, the topic, timing, format, or audience context?
After publishing, compare those predictions with actual outputs. A post that misses its impression forecast but exceeds its profile-visit forecast teaches you something different from a post that reaches widely and converts nobody. If views dropped unexpectedly, document the draft and distribution context instead of inventing a story from the visible count. A practical reference for that kind of diagnostic is Yubook's guide to dropped views.
Practical rule: A metric earns its place only when it changes the next draft, the next publishing slot, or the next experiment.
Analysis pays off when it creates a feedback loop. The workflow ahead gives you a defined objective, a cleaner dataset, conversion-aware calculations, context-sensitive interpretation, controlled tests, and a dashboard that turns forecasts into publishing decisions. A tidy report is optional. A changed calendar entry is the proof that the analysis worked.
Defining Objectives and Choosing the Right KPIs
Begin with the outcome, not the metric. A solo creator trying to grow a newsletter shouldn't optimize for the same signal as a founder building awareness or a social manager reporting campaign efficiency. The objective determines what you collect, which denominator you use, and what counts as success.
Consider three practical cases. A newsletter writer may care whether a reply leads to a link click, because a thoughtful conversation can create stronger intent than a passive like. A founder may prioritize qualified profile visits, since distribution matters only if the right people investigate the account. A social manager may need to compare the efficiency of engaged replies against campaign costs, not report total activity.
| Creator Type | Primary KPI | Keep | Drop |
|---|---|---|---|
| Solo creator pursuing newsletter signups | Reply-to-click rate | Replies, link clicks, profile visits, signups | Aggregate likes without click context |
| Founder building distribution | Qualified profile visits | Profile visits, follows from target audiences, meaningful replies | Follower count as a standalone target |
| Social manager reporting to a brand | Cost per engaged reply | Engaged replies, campaign spend, reply quality, assisted clicks | Raw impressions without an action attached |
Apply the next-week test
For every KPI, finish this sentence: “If this number changes, next week I will…” If the answer is to change the hook, posting window, call to action, audience target, or format, keep the KPI. If the answer is merely to add it to a report, it's decoration.
Follower count, raw impressions, and aggregate likes can still provide context. They shouldn't dominate the decision. A follower increase might reflect one unusual post, a mention from another account, or delayed discovery. Impressions might rise because distribution expanded while conversion weakened. Likes may confirm that the post was agreeable without showing whether anyone took the next step.
Your collection plan should reflect the chosen KPI. A creator measuring newsletter growth needs post-level link clicks and signups connected to the publishing window. A founder measuring qualified profile visits needs audience or account context, not just a total visit count. A manager measuring cost per engaged reply needs campaign spend and a consistent definition of “engaged,” otherwise comparisons become subjective.
Separate primary and secondary signals
Use one primary KPI and a small set of supporting signals. The primary KPI tells you whether the post did its job. Secondary signals explain why it did or didn't. That separation prevents the common failure where every visible metric competes for attention and no metric controls a decision.
Collecting and Cleaning Tweet Data Without Bias
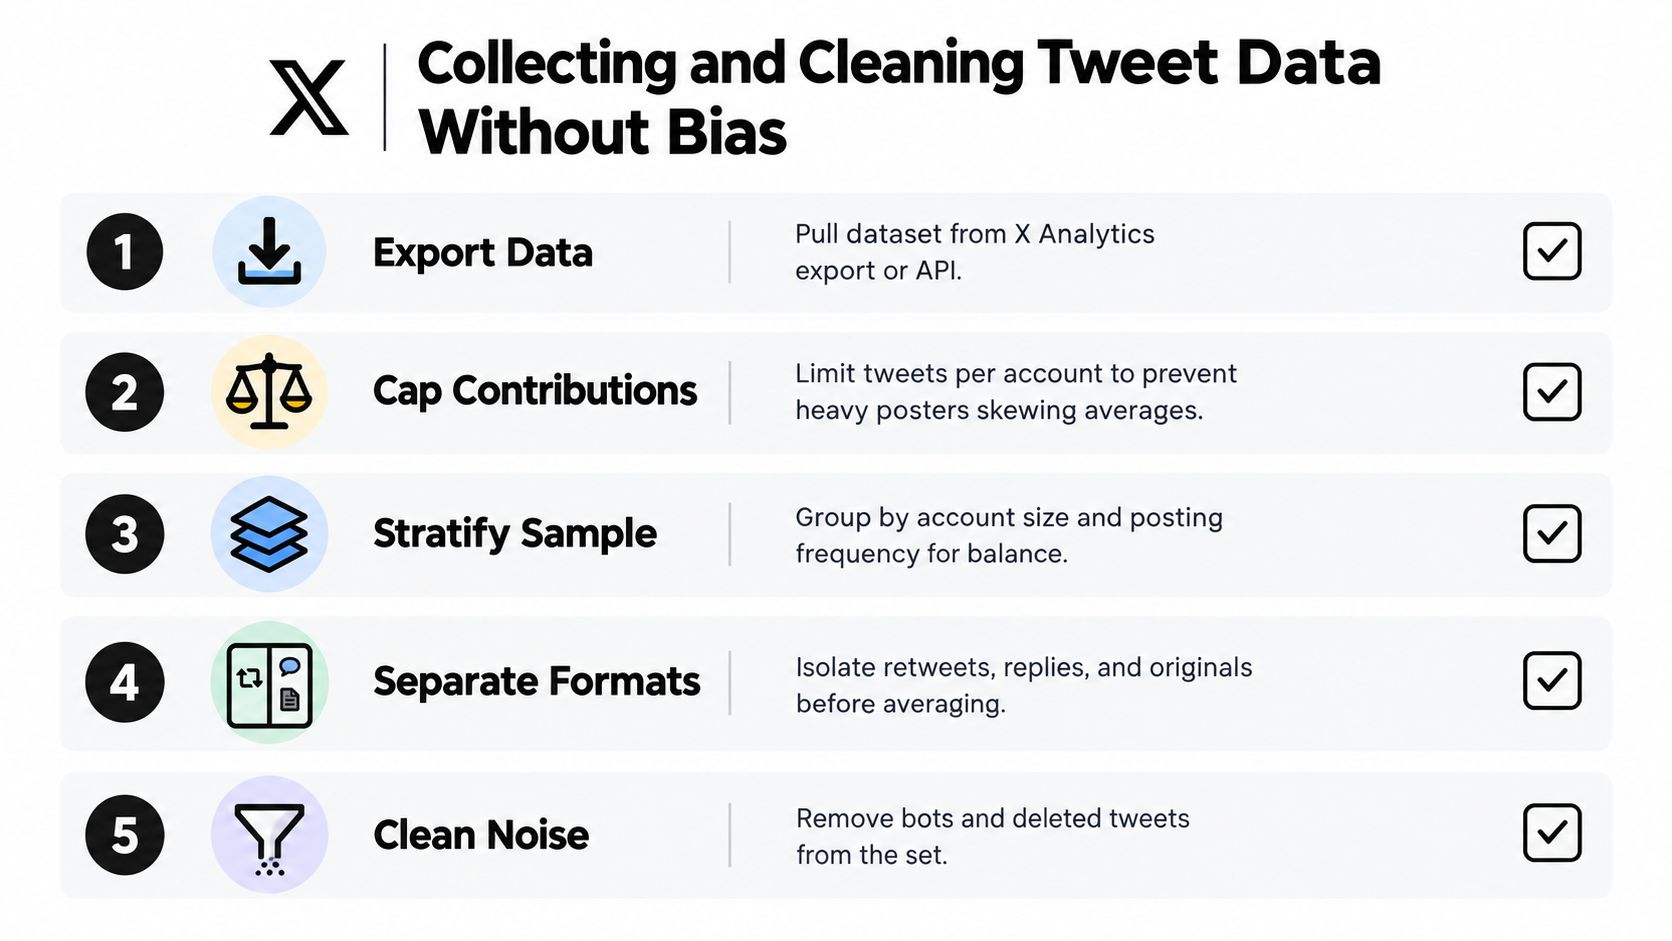
A dataset made only from your best tweets is a highlight reel, not a forecasting tool. To judge whether a draft pattern can repeat, collect ordinary posts alongside winners and failures. Export from X analytics or use an approved API workflow, preserving the original text, timestamp, format, impressions, engagements, clicks, replies, reposts, profile activity, and follower changes where available.
Sampling rules matter before a post goes live. Heavy posters can dominate averages, so an account that publishes more often may appear stronger even when each post performs worse. A generic sampling design can cap each author's contribution, separate accounts by posting frequency, and record the rule before reviewing outcomes. For a documented example of tweet-data collection and evaluation methods, see Pew's tweet content-analysis methodology. Do not present figures from that repository as Pew's study results. The practical rule is simple: define the sample first, then inspect the signals.
Build comparable groups
Tag every post before calculating averages. Separate:
- Format: Original text, image, poll, thread opener, reply, quote, and repost.
- Timing: Weekday or weekend, hour block, and audience-active window.
- Context: Campaign, launch, viral conversation, platform outage, or ordinary publishing.
- Audience: Account size, follower relationship, topic community, and likely reader intent.
- Status: Published, deleted, restricted, duplicated, or missing fields.
A viral thread, major news event, outage, or mention from a large account can distort a whole period. Flag these posts instead of deleting them. They may reveal a useful live experiment, but they should not be compared with ordinary posts as if their exposure conditions matched.
Name the bias before it enters the sheet
Survivorship bias appears when analysis includes only visible or successful posts. Recency bias appears when the current feed becomes the sample. Selection bias appears when low-impression posts are removed because they feel embarrassing or irrelevant.
Set a defined collection window, include every post type, preserve low-performing posts, cap author contributions, label formats, flag anomalies, and document how missing fields are handled. Keep raw counts separate from normalized rates. A heavy poster may collect more replies through volume, while a smaller account may create stronger conversation per post.
Use the cleaned dataset before publishing as a forecast check: compare a draft with prior posts in the same format, audience context, and timing window. After publication, add the result to the same sample rather than rewriting the rule around one unusually strong outcome.
Computing Engagement and Audience-Conversion Metrics
A public metric becomes useful when you assign it a job. Impressions describe surface distribution. Replies, reposts, profile clicks, bookmarks, and reading behavior help test whether the surface exposure created interest. Follows, link clicks, signups, and qualified direct messages measure conversion.
| Metric | What It Measures | Decision It Informs |
|---|---|---|
| Impressions | Delivered exposure | Whether the topic or context reached an audience |
| Replies | Conversation created | Whether the hook invites participation |
| Reposts and quotes | Distribution through other accounts | Whether the idea travels beyond the original audience |
| Profile visits | Curiosity about the account | Whether the post earns investigation |
| Follows | Account-level conversion | Whether the profile fulfills the promise of the post |
| Link clicks | Movement toward an owned destination | Whether the call to action creates intent |
| Signups or qualified DMs | Business or audience outcome | Whether attention became a useful next step |
Choose the denominator deliberately
Engagement rate per impression is calculated as total selected engagements divided by impressions, multiplied by 100. Engagement rate per reach uses the same numerator divided by unique reached users, multiplied by 100. Reach is generally the cleaner denominator when it's available because it reduces the distortion created when the platform serves the same post repeatedly or expands distribution unevenly.
Don't combine unlike actions into one score without stating the purpose. A like, a reply, a profile visit, and a signup indicate different levels of intent. If you need a single reporting view, keep the components visible and label the score as an internal decision aid, not a platform truth.
For example, a post with 12,000 impressions, 3,400 profile clicks, 180 replies, and 42 follows produces a reply rate of 1.5% and a follow rate of 0.35%, calculated against impressions. Those figures should be compared with the account's median baseline and the post's objective, not treated as universal benchmarks. The profile-click volume suggests substantial curiosity, while the follow count raises a sharper question: did the profile fulfill the promise made by the tweet?
Treat reading behavior as a diagnostic
Time spent reading can indicate whether a post held attention, but it shouldn't be treated as a perfect observable measure. Pair it with link clicks, replies, profile visits, and repeat visits where your tooling supports them. Likes alone can't tell you whether readers understood the point, returned later, or took a meaningful action.
Before publishing again, ask:
- Which metric represents the intended outcome?
- Is the denominator exposure, reach, or a downstream audience?
- Are actions separated by intent?
- Did the post create conversation or only passive approval?
- What exact change will the result make to the next draft?
Interpreting Content, Timing, and Network Signals
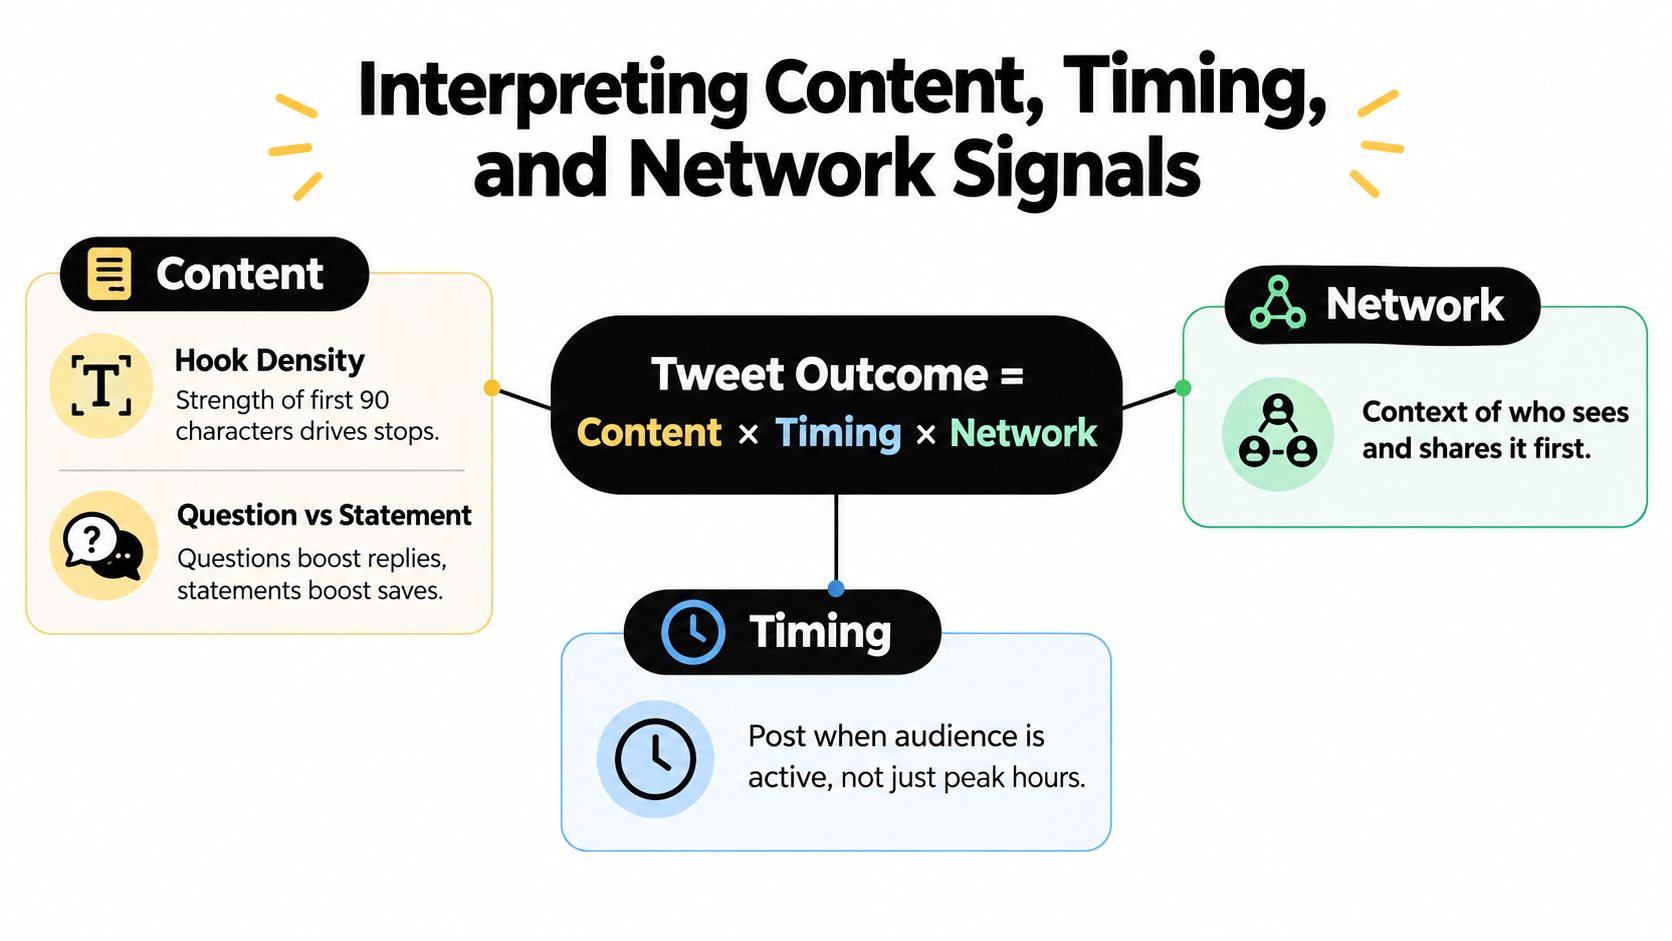
A tweet's outcome is better understood as content multiplied by timing multiplied by network context, not as a simple sum of isolated variables. A strong draft can disappear in a weak distribution window. A mediocre draft can travel because the first readers have a reason to share it. If you change all three conditions at once, the result won't tell you which factor mattered.
Read the draft at the speed of a feed
Inspect the opening before you inspect the analytics. Ask whether the first line makes a specific promise, names a tension, or gives the reader a reason to continue. Compare a generic claim such as “Good content needs consistency” with a sharper version that names the failure, audience, or decision involved.
Question framing often creates a different reply environment from statement framing. An embedded image, chart, screenshot, or code artifact can make an abstract claim easier to inspect, but it can also distract from the argument if it carries no additional information. Label these choices in your dataset so you can compare formats instead of relying on memory.
Treat timing as a controlled condition
Record day, hour, audience-active window, and the delay between publishing and the first meaningful distribution. “Best time” advice is too broad without account-specific evidence. Yubook's best-time guidance is more useful as a prompt to connect timing with your own audience and post history than as a universal schedule.
Suppose the same draft posted Tuesday morning earns a different reply rate from a Thursday afternoon version. You can't conclude that the day caused the difference if the audience, network exposure, or format also changed. Match time slots, rotate the order, and repeat the comparison while keeping the draft variable stable.
Map the first readers
Who saw the post first matters. Track whether an established follower replied early, whether a relevant account quoted it, and whether replies created a secondary conversation. Quote posts can expose an idea to a different audience, while replies may deepen the original thread without producing the same downstream distribution.
A timing pattern is only useful when the content and first-distribution context are comparable.
Running Experiments and A/B Tests on Real Drafts
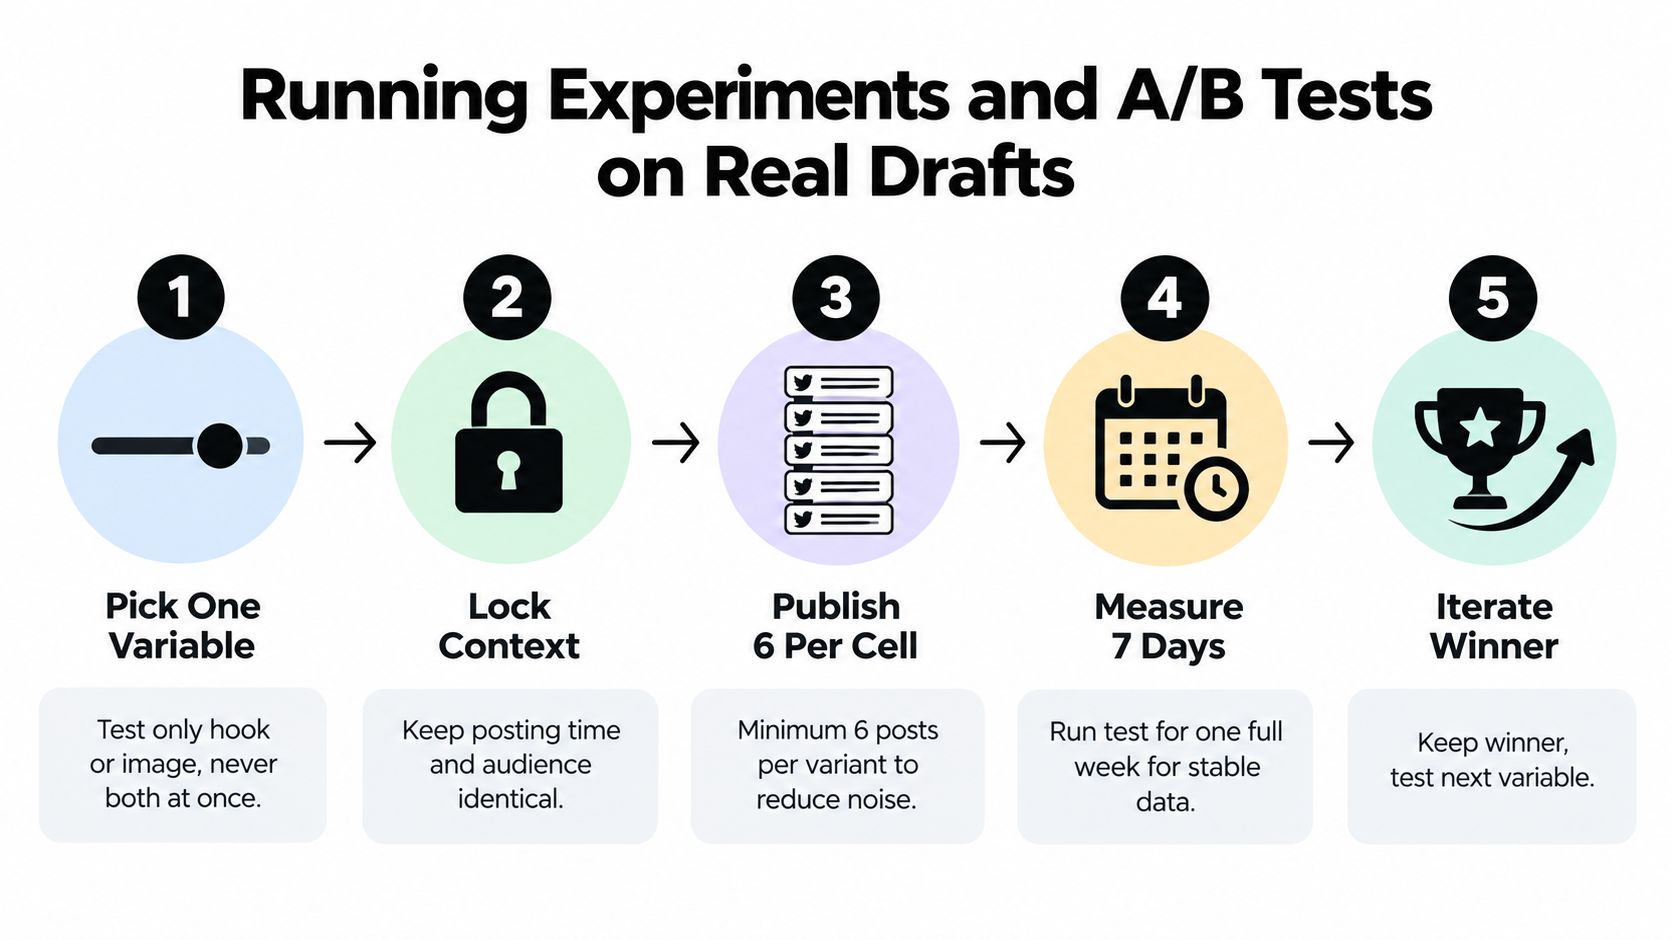
A/B testing should begin before publication, not after a post flatters your dashboard. Write a forecast and a hypothesis first: “A specific number in the hook will produce more reply intent than a generic claim.” Then create two drafts that change only that variable. Keep the image, topic, length, call to action, and publishing context stable.
For a solo creator, the workflow can fit inside a normal publishing week:
- Choose one variable: Hook specificity, question framing, image presence, or call-to-action wording.
- Lock the context: Match audience, format, topic difficulty, and publishing windows as closely as possible.
- Repeat the comparison: Use at least six posts per cell as a working rule to reduce noise, not as proof of statistical certainty.
- Forecast before publishing: Record expected impressions, replies, profile visits, and conversion direction.
- Set review windows: Check early signals after two hours and settle outcome metrics after 48 hours. Do not reopen the test because a later outlier looks persuasive.
Keep the forecast visible
A forecast-versus-actual table limits hindsight. It forces you to compare the decision you expected to make with the evidence you collected.
| Test | Forecast | Actual Review | Decision |
|---|---|---|---|
| Specific hook versus generic hook | Specific version should attract more replies and profile visits | Compare matched medians after the review window | Promote only if the pattern repeats across the test set |
| Question versus statement | Question should create more direct conversation | Compare replies and reply quality | Keep question framing for discussion posts |
| Artifact versus text-only | Artifact should improve inspection and saves | Compare meaningful actions, not likes alone | Use artifacts when they add evidence |
The decision rule matters more than a dramatic result. Promote a variable when it improves the primary KPI without weakening the intended conversion, and when the pattern appears across comparable posts rather than one exceptional outlier. A flat result still removes a hypothesis from future drafts. It can stop you from applying a favored tactic to every post.
Use benchmarks without overfitting
Public benchmarks help organize language analysis, but they do not reveal X's private ranking weights or predict a specific account's performance. the TweetEval benchmark covers seven English tweet classification tasks, including sentiment, emotion, offensive language, hate speech, stance, emoji, and irony. Use that discipline in publishing tests: keep labels, preprocessing, and review windows consistent, then treat topic and community changes as possible distribution shifts.
Separate the platform's public signals from your measured outcomes. A draft may receive attention without generating profile visits, replies without qualified conversations, or impressions without audience growth. Forecast each step, record the actual result, and change one publishing decision at a time.
Tools, Dashboards, and Forecasts That Close the Loop
A dashboard that only ranks last week's posts is a record, not a forecasting system. The useful stack captures draft signals, stores comparable outcomes, and makes the next publishing choice easier to test.
Native X analytics can cover basic account review. It provides post-level fields such as impressions, engagements, clicks, replies, reposts, and follower changes. Its dashboard format also supports recurring reviews of monthly performance, top posts, audience interests, and engagement timing, as summarized in Socialinsider's Twitter analytics reference. The gap is context. Native views may not connect reply quality across platforms, attribute a signup to a full publishing sequence, or compare a pre-publish forecast with measured performance over time.
Tool categories carry different trade-offs. Buffer and Tweet Hunter support scheduling and content operations, but a queue does not explain why a post converted. Yubook analyzes drafts against public ranking signals, provides an explainable forecast range, and connects attention with follower conversion across X and Threads. It should not be treated as an official source of private platform ranking inputs.
| Tool Category | Examples | Best For | Limitation |
|---|---|---|---|
| Native analytics | X analytics views and exports | Basic post review and account-level signals | Limited cross-platform attribution and forecast comparison |
| Scheduling and publishing | Buffer, Tweet Hunter | Planning, queues, and repeatable publishing operations | Scheduling alone doesn't explain why a post converted |
| Data collection workflows | API or approved export pipelines | Structured datasets and recurring capture | Requires cleaning, labeling, and bias controls |
| Publishing intelligence | Yubook | Draft review, forecast ranges, experiment loops, and conversion analysis | Forecasts are probability ranges, not guaranteed outcomes |
Put forecasts beside actuals
A useful dashboard stores more than a post's final rank. Keep the draft forecast, publishing context, early signals, outcome metrics, and decision in the same record. For account-specific timing, Yubook's best-time guidance turns historical reply and visit data into a suggested publishing window.
A draft may receive a moderate pre-publish score, run during the audience's active window, earn fewer impressions than expected, and still produce stronger profile conversion. The next forecast should lower its distribution expectation while preserving the content and conversion insight. That correction is more useful than labeling the post a permanent winner.
Use ranges rather than precise promises. A public-signal model can identify factors associated with likely performance, but it cannot see every private ranking input, audience change, event effect, or competing post in the feed. Record the expected range before publishing, then compare it with both early attention and downstream action.
Avoid the dashboard traps
Analysis usually fails through operating mistakes:
- No decision attached: The team reviews charts but does not specify what changes in the next publishing cycle.
- Outlier worship: One post receives unusual distribution, then becomes the template for every draft.
- Single-metric optimization: Impressions rise while reply depth, profile conversion, or signup intent falls.
- Stitched exports: Tools use inconsistent naming, windows, and denominators, making comparisons unreliable.
- Hidden context: A viral mention or unusual event remains mixed with ordinary posts.
Use one source of truth where possible. Keep raw fields, derived rates, labels, forecasts, and decisions in the same record. If several tools are necessary, document which system owns each field and how conflicts are resolved.
Turn the review into the next calendar entry
Before the next post, complete this checklist:
- Select one variable from the previous experiment.
- Write the forecast range for the primary KPI and supporting signals.
- Choose a matched publishing context and record why.
- Schedule the draft without changing the test variable afterward.
- Pre-commit the review window for early and outcome signals.
- Record the decision before moving to another hypothesis.
Tweet analysis earns its place when it changes the next draft. The dashboard preserves the reasoning. The forecast states what should happen. The live experiment tests whether that expectation survives contact with the feed.
Yubook helps creators and teams analyze drafts against public X and Threads signals, forecast likely outcomes with visible uncertainty, and compare predicted performance with measured results. Visit Yubook to connect draft review, timing, publishing, and follower-conversion analysis in one workflow.