Social Media Benchmarking Tool Guide for X Growth
Learn what a social media benchmarking tool does, key metrics, workflows, and how to choose one for X and Threads with forecast vs actual learning.
Upkeep · 2026-09-12 · 44 min
You publish a post on X or Threads, watch the likes and replies rise, and expect the follower count to follow. Instead, the post gets attention for a moment, profile visits remain difficult to interpret, and follower growth barely moves. The problem usually isn't a lack of data. It's that the data answers the wrong question.
A social media benchmarking tool should help you understand more than whether a post ranked well beside other posts. It should show how your result compares with your own history, relevant peers, and the platform context, then connect that public attention with outcomes you can measure. On X and Threads, that means separating visible signals such as likes, replies, reposts, and views from profile visits, follows, repeat visits, and other indicators of audience growth.
Table of Contents
- Introduction Why Benchmarking Matters More Than Vanity Metrics
- What a Social Media Benchmarking Tool Actually Does
- Core Metrics and Workflows That Make Benchmarks Trustworthy
- How to Run a Benchmarking Process From Baseline to Learning Loop
- How to Choose the Right Social Media Benchmarking Tool
- Yubook in Action Draft Forecasts to Follower Conversion on X and Threads
- Common Pitfalls That Make Benchmarks Mislead and How to Avoid Them
Introduction Why Benchmarking Matters More Than Vanity Metrics
A creator can have a post that looks successful in isolation. It receives more replies than usual, attracts profile visits, and appears to outperform an account average. Yet the same post may produce few new followers because the profile promise is unclear, the audience is too broad, or the conversation attracts curiosity without long-term interest.
That distinction changes the job of measurement. A raw count tells you what happened. A benchmark helps you ask whether the result was strong for this account, this platform, this audience, and this objective.
Practical rule: A post isn't successful simply because it gets attention. It's successful when the attention matches the outcome you intended to create.
For X and Threads creators, useful comparisons usually come from three places:
- Your own history: Did this post outperform your normal results under similar conditions?
- Comparable peers: Did it perform well against accounts with a similar audience, topic, and publishing context?
- Relevant category context: Is the result typical for the type of content and platform you're using?
The market around social media analytics reflects this shift toward comparative measurement. The category was estimated at USD 10.23 billion in 2024 and projected to reach USD 43.25 billion by 2030, with a projected 27.2% compound annual growth rate from 2025 to 2030, according to Fortune Business Insights' social media analytics market analysis. The same source identifies North America as accounting for 32.8% of global revenue in 2024 and reports that the solution segment generated USD 7.40 billion, which helps explain why benchmarking now sits inside broader business intelligence workflows rather than only inside reporting dashboards.
This guide builds a practical mental model. You'll learn what these tools compare, why metric definitions change rankings, how to run a forecast-versus-actual learning loop, and how to evaluate tools without paying for a large dataset that gives you no clear next action.
What a Social Media Benchmarking Tool Actually Does
Think of a bathroom scale and a fitness tracker. The scale gives you one reading. The tracker helps you see patterns over time, compare activity with your routine, and decide what to change next. A social media benchmarking tool should work more like the tracker.
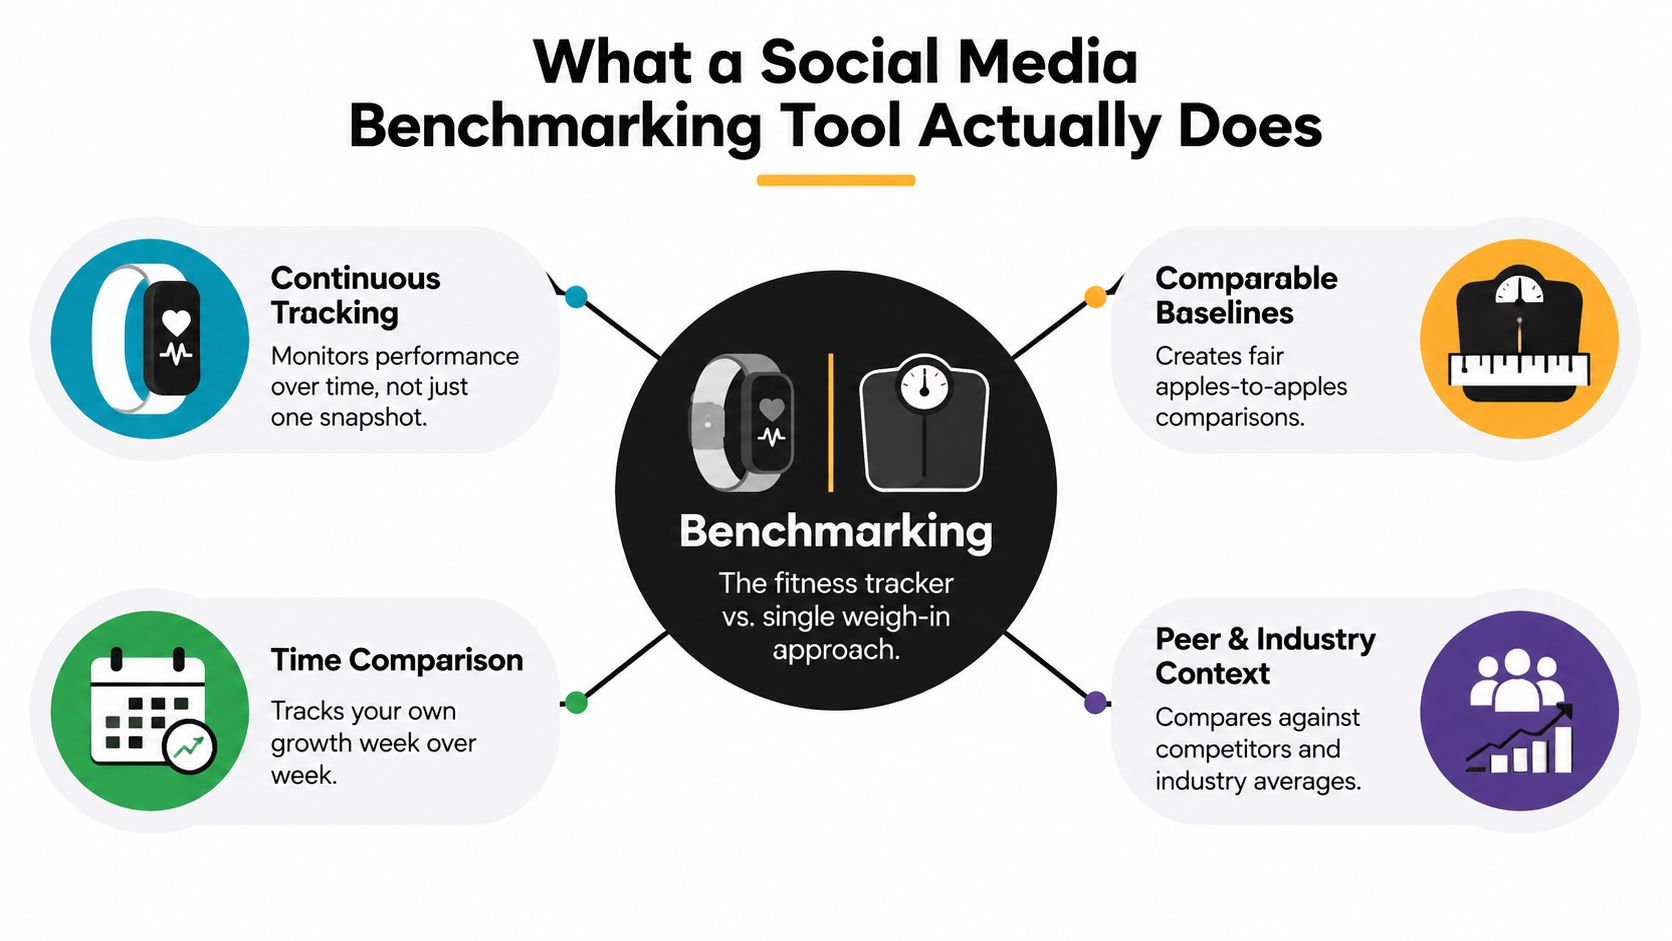
A single post's likes or views are a snapshot. Benchmarking adds a reference point, but the reference point must be comparable. Brandwatch's explanation of social media benchmarking recommends normalizing comparisons by platform and audience size, then reviewing internal history, direct competitors, and industry aggregates. It also recommends re-benchmarking quarterly so the comparison remains meaningful as audience composition changes.
The three comparison lenses
Personal history answers, “Is this normal for me?” A creator might compare posts with similar formats, topics, and publishing windows. This protects you from judging an experimental post against a completely different piece of content.
Competitive context answers, “How do I compare with relevant accounts?” The useful word is relevant. A large entertainment account isn't automatically a meaningful peer for a solo developer writing about technical product work. Audience size, subject matter, publishing style, and platform should shape the comparison group.
Industry context answers, “What does this type of performance look like in the wider category?” Industry averages can provide orientation, but they shouldn't replace account-specific evidence. A broad average may hide major differences in audience intent and content format.
Public signals are not business outcomes
Likes, replies, reposts, views, and visible conversation can help describe public performance. They don't automatically prove that the post grew your audience or supported a business goal. A post can attract broad curiosity, while another reaches fewer people but generates more qualified profile visits and follows.
That's why a useful tool should answer two separate questions:
- How did the post rank among comparable public signals?
- What did people do after encountering it?
The historical shift toward integrated analytics supports this model. Mordor Intelligence's social media analytics market report describes a category that moved from standalone reporting toward integrated analytics platforms, with forecasts that differ substantially but consistently point toward rapid expansion. The important implication isn't one market estimate. It's that vendors increasingly sell comparative intelligence, not merely a page of totals.
In one sentence, a social media benchmarking tool turns isolated post metrics into fair comparisons and connects those comparisons to decisions about content, timing, audience, and conversion.
Core Metrics and Workflows That Make Benchmarks Trustworthy
A benchmark can look precise and still be misleading if the calculation underneath it changes from one report to another. The most common source of confusion is the denominator used for engagement rate.
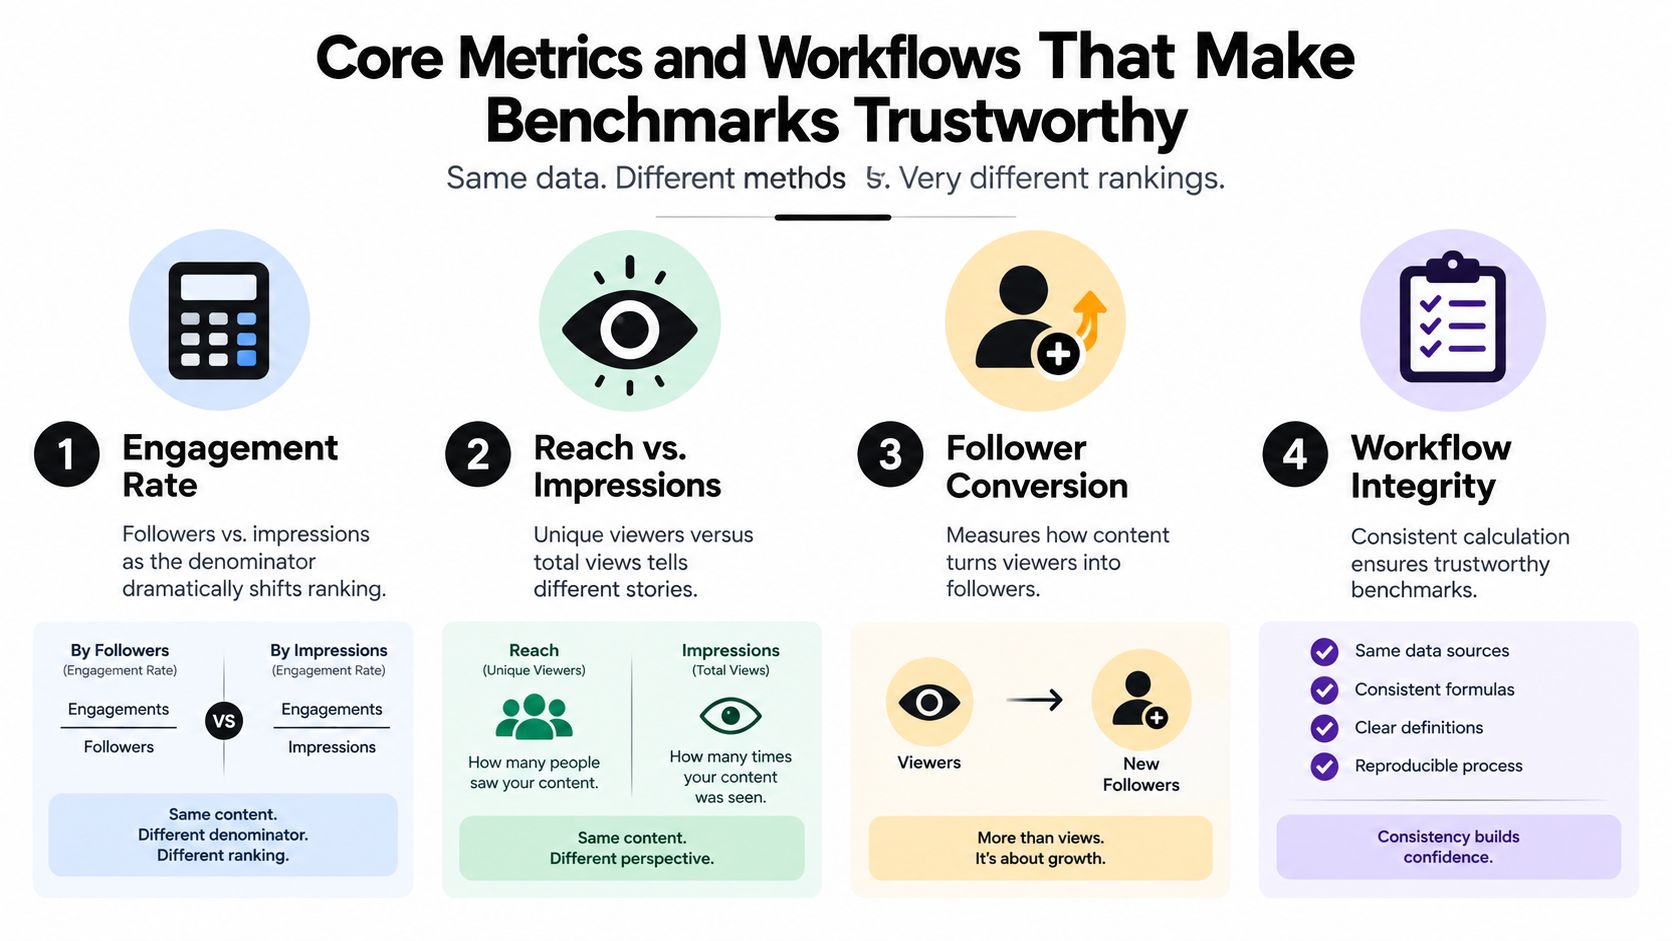
One tool may calculate engagement per post as interactions divided by followers. Another may divide interactions by impressions or views. Socialinsider's social media benchmarks explains that engagement measurement can use different approaches, including quantitative measures, normalized indexes, and sets of indexes. Those choices can change rankings even when the underlying post activity stays the same.
Read the denominator before the result
Suppose two posts receive similar interaction counts. If one report divides by followers and another divides by impressions, the resulting rates aren't interchangeable. The follower-based version asks how the post performed against the account's audience base. The impression-based version asks how efficiently the post generated interaction against total exposure, including repeat displays.
Neither formula is automatically the engagement rate. Each answers a different question. A trustworthy report names the denominator, identifies which interactions count, and applies the same definition across the comparison set.
Reach and impressions also describe different things. Reach is about unique viewers, while impressions count total displays. A post can have repeated exposure without reaching the same number of distinct people, so those measures shouldn't be substituted casually.
Measure the movement after attention
For an X or Threads creator, follower conversion deserves a place beside public engagement. You can examine whether profile visits led to follows, whether visitors returned, and whether a post attracted the kind of audience you want to keep. This is the layer that explains why a post can beat a public benchmark yet fail to grow the account.
Timing and spacing belong in the same analysis. A post may perform differently when published after a long quiet period, during a crowded conversation, or close to another post. Treat timing as context for the comparison, not as a universal rule that applies to every account.
Use this reading checklist when you open a benchmark report:
- Metric definition: Confirm which actions count as interactions.
- Denominator: Check whether the calculation uses followers, reach, impressions, or views.
- Audience scale: Compare accounts with reasonably similar audience size and composition.
- Platform: Keep X and Threads comparisons separate unless the tool clearly normalizes them.
- Time window: Match comparable publishing periods and allow enough time for delayed results.
- Refresh schedule: Re-benchmark quarterly as the audience and content mix change.
The most useful benchmark isn't the one with the most decimal places. It's the one whose definitions you can explain to another person.
For a practical timing reference, use Yubook's best-time guide as one input alongside your account's own observations, not as a replacement for testing.
The following video provides another way to think about measurement workflows and interpretation:
How to Run a Benchmarking Process From Baseline to Learning Loop
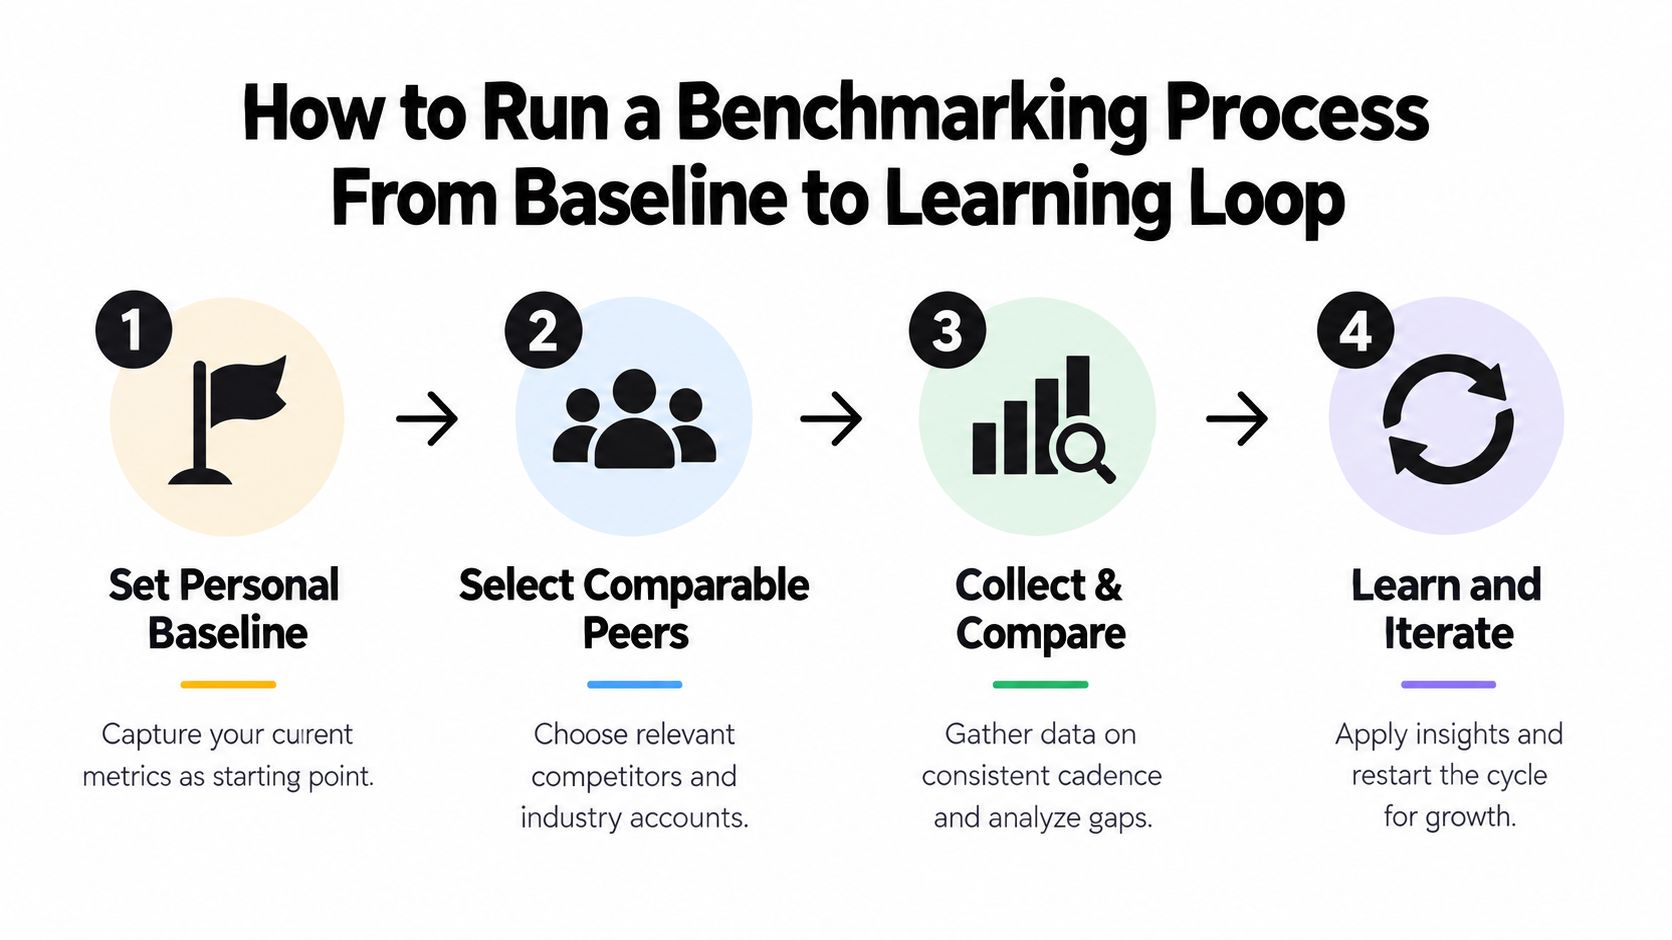
A useful benchmarking process starts before you publish. It gives each post a reference point, a test condition, and a defined review window. Without those three elements, you're likely to remember the most exciting result and forget the conditions that produced it.
Start with a personal baseline
Group recent posts by meaningful similarities, such as platform, format, topic, and publishing purpose. Record public signals, profile visits, follows, repeat visits, and the time since publication. You don't need a complicated dashboard at first. You need a consistent record that lets you distinguish a real pattern from one unusually visible post.
Next, choose peers carefully. Select accounts that compete for a similar audience or participate in the same conversations. For X and Threads, include the platform in the peer definition because a public response pattern on one network may not transfer directly to the other.
Run one controlled experiment
Choose one variable to test. You might change the opening sentence, the reply strategy, the call to visit your profile, or the time you publish. Keep the other conditions as stable as possible, then record the expected outcome before the post goes live.
A forecast should be treated as a range, not a promise. If a tool gives you a draft-signal forecast, save the forecast version and the signals that informed it. This creates a record you can compare with actual performance rather than rewriting your expectation after the result arrives.
Review the result across time
Look at the post after an early review window, then again as longer-term results accumulate. Yubook's performance replay illustrates this type of loop by comparing predicted and actual performance from the early period after publishing through the account's available history. The point isn't to declare a post good or bad from one snapshot. It's to identify where the forecast and outcome diverged.
Turn each gap into a specific next action:
- High public attention, weak follows: Rewrite the profile promise or make the post's audience more explicit.
- Low reach, strong conversion: Study the topic and distribution conditions before changing the message.
- Strong replies, weak repeat visits: Improve the connection between the conversation and the account's broader value.
- Forecast consistently high: Check whether the public signals are overweighted relative to account-specific outcomes.
- Forecast consistently low: Review whether your account has developed a repeatable pattern the model hasn't captured.
Keep a versioned note of the signal source, metric definitions, peer group, and experiment condition. That record lets you recalibrate instead of starting from memory each time.
Learning-loop principle: The result of one post matters less than what it teaches you about the next forecast.
How to Choose the Right Social Media Benchmarking Tool
Tool selection should begin with the job you need done. A creator focused on follower conversion needs different evidence from a social manager preparing a cross-channel report. A SaaS team may care about account-specific learning, while an analyst may prioritize peer groups, filters, and exportable definitions.
Use the matrix below to separate useful capability from impressive but vague feature language.
Benchmarking Tool Evaluation Matrix
| Evaluation Criteria | What Good Looks Like | Why It Matters |
|---|---|---|
| X and Threads peer flexibility | Separate peer groups by platform, topic, audience scale, and creator type | Prevents broad brand averages from distorting creator comparisons |
| Percentile bands | Shows where a result sits within a defined comparison group | Gives more context than one average |
| Geographic filters | Lets you compare accounts or audiences by relevant market | Helps account for regional audience differences |
| Forecast explanation | Identifies the public signals behind a forecast and shows uncertainty as a range | Makes the prediction inspectable rather than magical |
| Public versus actual outcomes | Keeps visible ranking signals separate from profile visits, follows, and repeat visits | Prevents attention from being mistaken for conversion |
| Cross-post measurement | Compares the same draft on X and Threads without blending their results | Reveals platform-specific strengths |
| Follower-conversion analytics | Connects profile curiosity with follow conversion and return behavior | Shows whether attention builds an audience |
| Calibration over time | Replays predictions against actual outcomes and stores account-specific patterns | Turns publishing history into training material |
| Actionable recommendations | Suggests a next experiment, rewrite, reply target, or timing adjustment | Converts reporting into a decision |
| Method transparency | Names formulas, data windows, source versions, and limitations | Makes comparisons repeatable and defensible |
A tool that only reports averages may help with orientation, but it won't necessarily tell you what to change. Prescriptive guidance becomes more valuable when it explains why a recommendation appears and distinguishes observed evidence from modeled expectation.
Be cautious with cross-platform dashboards that flatten X and Threads into one score. Unified reporting is useful for workflow, but the benchmark should preserve each platform's separate context. A post can generate stronger conversation on one platform and better follower conversion on another, and a blended score may hide that difference.
For solo creators, prioritize clear feedback and low setup friction. For teams, prioritize definitions, permissions, exportability, and repeatable reporting. For growth-focused publishers, ask one hard question before subscribing: Will this tool help me learn which attention turns into retained audience, or will it only show me who received the most attention?
Yubook in Action Draft Forecasts to Follower Conversion on X and Threads
A forecast-versus-actual workflow becomes easier to understand when you follow one draft through the publishing cycle. Yubook provides a browser-based draft studio that analyzes a draft against public X signals before publishing, while keeping typing on the device and separating the forecast from the later measured outcome.

Before publishing, the creator receives an explainable forecast range rather than an alleged official platform score. The useful question is not “What score did the platform give me?” It's “Which public signals support this expectation, and how uncertain is the estimate?”
The same draft can then be published to X and Threads, with results measured separately. That preserves the comparison instead of assuming that one platform's response predicts the other's. A creator might find that the wording creates discussion on X, while the same idea produces more profile curiosity on Threads.
The next step is the outcome layer. Yubook's audience growth analytics connect profile visits with follow conversion and repeat visits. This helps diagnose the frustrating situation from the opening: a post can perform well on visible ranking signals but fail to create durable audience growth.
Turning replay into a better next draft
Performance replay compares the prediction with actual performance from the period after publishing through longer-term history. A gap between forecast and outcome becomes useful when you label it precisely:
- The draft attracted more public attention than expected, but visitors didn't follow.
- The forecast matched reach, but conversation quality was weaker.
- Replies created additional discovery, but the profile didn't explain the account's value.
- A quieter post generated fewer visible interactions but stronger repeat visits.
The surrounding workflow can support those observations with a reply target queue, a staged seven-day growth plan, and account-specific pattern memory. These features are most useful when they guide experiments rather than encourage blind repetition. The system can also preserve versioned signal sources, so you know whether a later recommendation reflects updated public evidence or a change in your own account pattern.
For a closer look at X draft checking, visit Yubook's X check workflow. Use the result as a starting hypothesis, then let measured conversion and replay determine whether the hypothesis deserves another test.
Common Pitfalls That Make Benchmarks Mislead and How to Avoid Them
The first mistake is comparing raw totals. A larger account will often collect more visible activity just because it has a larger audience, so totals alone don't tell you whether the content was efficient or persuasive.
The second is mixing engagement formulas. If one report divides interactions by followers and another divides by impressions, their rates describe different relationships. Keep the formula, timeframe, platform, and audience definition consistent.
Separate the signal from the outcome
Public reach can help explain distribution, but it isn't the same as business impact. A post can rank visibly and still fail to produce follows, repeat visits, or meaningful conversation. Review those outcomes separately instead of folding them into one flattering score.
Don't use large brand averages as the default for volatile X and Threads contexts. Choose peers with similar audience conditions, refresh the comparison quarterly, and show forecasts as ranges when uncertainty matters.
Follow-for-follow tactics create another measurement problem. They can inflate surface-level audience numbers without building a relevant readership, while rule-compliant replies and useful conversations can attract people who choose to return.
When views or reach fall, resist the urge to change everything at once. Yubook's guide to diagnosing dropped views can help frame the issue as a comparison and investigation problem rather than an immediate reason to copy another account.
Treat every post as an experiment with a forecast, an observed result, and a next adjustment. That habit turns benchmarking from a vanity report into a practical learning system.
Yubook connects draft signal analysis, X and Threads publishing, follower-conversion analytics, and prediction-versus-actual replay in one workflow. Visit Yubook to test a benchmarking approach that keeps public ranking signals separate from measured audience growth.