Social Media Conversion Tracking That Actually Works
A practical guide to social media conversion tracking for X and Threads creators covering profile visits, follows, experiment design, and cookieless counting.
Upkeep · 2026-08-29 · 37 min
You know the feeling. A post takes off, the likes stack up, the reply thread looks healthy, and then the follower graph barely moves. That's usually the moment creators realize engagement isn't the same thing as conversion, and that a dashboard full of impressions can still hide a weak audience path.
For X and Threads, social media conversion tracking should answer a simpler question than ad attribution does. It should tell you whether a post drove a profile visit, whether that visit became a follow, and whether the person came back later because the account earned attention. Google Analytics' definition of attribution, assigning credit to important user actions across ads, clicks, and factors along the path, is useful here because it reminds you that social traffic usually isn't a single-touch story, it's a chain of signals that need to be separated before they can be improved (Google Analytics attribution guidance).
The working rule for the rest of this piece is blunt. If a metric doesn't change what you'll publish next week, it's decoration. That means we care about profile visits, new follows, and repeat visits, not vanity totals that look good in screenshots and die in decision meetings.
Table of Contents
- What Social Media Conversion Tracking Means for Creators
- The Plumbing of Tracking on X and Threads
- Tracking Profile Visits, Follows, and Repeat Visits
- Designing Experiments You Can Trust
- Cookieless Counting and Privacy-Safe Measurement
- A Two-Week Setup Plan You Can Run Today
- Closing the Loop Between Tracking and Better Drafts
What Social Media Conversion Tracking Means for Creators
A post can spike attention and still fail to move the follow graph. That gap matters for indie creators, because social media conversion tracking should measure what happens after the view, not just around it. For creator accounts, a conversion is any committed action that moves someone closer to reading, following, or coming back.
The creator funnel is upside down
Creator funnels on X and Threads start with attention, then ask for commitment after the scroll. Profile visits sit at the center of that shift. They show that someone cared enough to inspect the account, check the bio, and decide whether the feed feels worth their time.
The sequence is practical. Profile visit signals curiosity. Follow signals trust. Repeat visit signals a habit forming around the account. Google Analytics' attribution model documentation explains how credit gets assigned across a path, and that same logic applies here, because one post may start the interest while another post finishes the follow or return visit (Google Analytics attribution reports).
Practical rule: If a metric does not help you decide whether to change the bio, the hook, the CTA, or the posting format, leave it out of the dashboard.
Raw likes, broad impressions, and follower totals without context do not tell you much. They can still sit in the background as awareness signals, but they should not drive the next draft or the next experiment. The useful numbers are the ones tied to repeated behavior, because creator growth comes from curiosity becoming trust, and trust becoming return visits.
That is also why creator tracking is different from channel reporting. A post can look strong in the feed and still do little for the account. If a number does not change the next decision, it is decoration.
The Plumbing of Tracking on X and Threads
A creator can get useful conversion data on X and Threads without building a giant stack. What matters is a clean event trail, a consistent join key, and the discipline to stop blending platform counts with guessed totals. A simple sheet is enough if it records date, source post id, profile_visits, new_follows, and link_clicks, then pairs those rows with daily snapshots from the platform dashboards.
Build the measurement spine first
Start at the link layer. Use UTM-tagged links in a bio or pinned post when the goal is to route people off-platform, then keep the post id in the same row as the result. On X, pull profile visits and follows from the analytics export. On Threads, use the built-in insights for view and follow changes. The point is not fancy tooling, it is preserving the link between the post and the outcome.
Keep a parallel capture. Platform numbers are not raw event logs. X shows aggregated, sampled numbers, so a daily snapshot in your own sheet gives you a source of record when the dashboard changes later. That is the step many creators skip, then they cannot explain a good week or a bad one after the fact.
A spreadsheet works. So does a small database or a no-code connector that pulls in daily values. If you want a quick sanity check for X-specific tracking, this X analytics check workflow is the kind of setup I would use before trusting an experiment.
Keep the join key boring
The join key should be the post id. The attribution hint should be the UTM source. The source of record should be the weekly CSV, not memory, guesses, or what seemed to work on Tuesday.
When that spine is in place, the dashboard stops being the argument. Then the useful questions show up: which post brought browsers, which one brought believers, and which one turned a one-time click into a returning visitor? For creator growth, that is a better operating system than chasing impressions in five tabs.
Tracking Profile Visits, Follows, and Repeat Visits
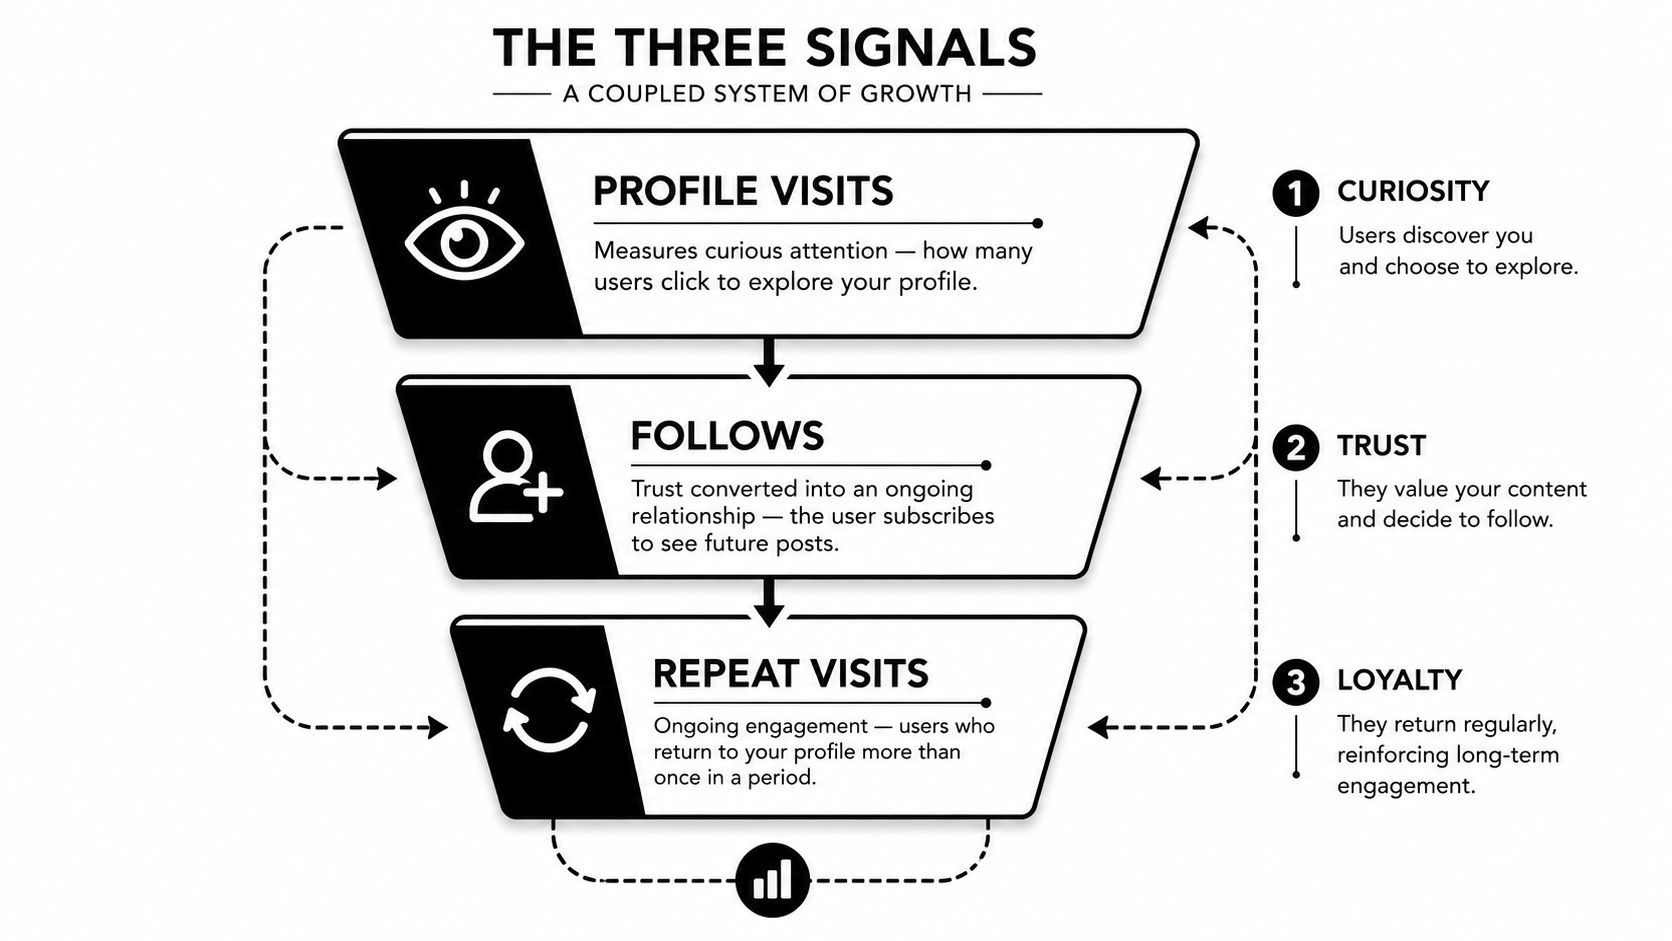
These three signals work as one system. A post can earn curiosity without trust, trust without habit, or habit without enough discovery. Social media conversion tracking should show which link in that chain is weak, so the next draft fixes the right problem.
Read the signals in order
Profile visits sit at the top of the creator conversion path. They show that a post created enough interest to make someone open the account instead of scrolling past. Follows are stronger than visits because they mean the account earned enough confidence to land in someone's feed. Repeat visits show the account brought the person back, which is a better sign of habit than a single session.
Start with the visit-to-follow relationship. If visits are high and follows are thin, the profile is not making a clear enough promise. If follows look healthy but repeat visits sag, the content may be drawing one-off curiosity instead of a reason to return. I treat repeat-visit problems as creative problems, not measurement problems, because no dashboard fixes posts that do not give people a reason to come back. If you need a quick check on whether the account itself is doing the work, a shadowban diagnostic tool is a practical place to start.
A profile that earns visits but not follows is usually asking for commitment too late or too vaguely.
Segment by post, not by vibes
Use the source post id you captured earlier to group signals by the draft that drove them. That lets you separate browsers, believers, and returners. A thread-style post may earn more visits while a short opinion post earns more follows. That is not a conflict, it is a clue about format and audience intent.
The risk is optimizing one signal alone. Push follows too hard and the account can attract the wrong audience. Push repeat visits too hard and you can overfit to existing fans. The safer move is to watch all three signals over a rolling four-week band, then change the next post's format when one ratio moves out of line.
Keep the review note blunt. If visits rise but follows stall, adjust the profile and CTA. If follows rise but repeat visits fade, tighten the promise of the content. If repeat visits stay healthy but visits fall, the discovery layer needs work. That is enough to decide the next draft without turning the dashboard into a vanity report.
Designing Experiments You Can Trust
The fastest way to lie to yourself with tracking is to change five things at once and call it testing. Good experiment design makes each post a deliberate hypothesis, not a mood swing with a spreadsheet attached. The answer should tell you whether a hook, a CTA, or a posting pattern moved the signal you care about.
Use a fixed experiment card
| Field | Example |
|---|---|
| Change | Hook style, from insight-led to contrarian |
| Single variable | First line only |
| Success metric | Follows per profile visit |
| Duration | Two weeks |
| Decision rule | Keep the new hook if it beats the holdout and doesn't hurt repeat visits |
Run the test on the same day of week when you can. That reduces traffic-shape noise, which matters because creator performance often swings with routine, not just content quality. If you need a quick reference for timing discipline, this best-time planning guide fits naturally into the same workflow.
Separate exploratory from confirmatory work
Exploratory testing is for signal hunting. Confirmatory testing is for proving one bet against a holdout. Don't blur them, because a messy week can create a false winner if you don't protect a slice of posts from the change.
A lightweight holdout is enough for most small teams. Keep a small percentage of posts untouched so you can see whether the baseline drifted while you were testing. If the holdout and the test both move, the platform, topic, or seasonality may be the primary driver. If only the test moves, you've got something worth carrying forward.
Decision rule: write the rule before you publish the test, then follow it even if the result is emotionally annoying.
Record the outcome in plain language, not just in a green or red cell. Say what changed, what the tracked signal did, and what the next draft should do differently. That habit turns experiments into a learning archive instead of a pile of forgotten screenshots.
Cookieless Counting and Privacy-Safe Measurement
The old dream of perfect user-level tracking has already slipped away for most creator workflows. X and Threads give you aggregate views of impressions, profile visits, and follows, but not a clean personal trail across devices and apps. That's not a bug in the creator stack, it's the reality of privacy-safe measurement.
Stop waiting for pixel-level certainty
The W3C's 2025 Privacy-Preserving Attribution work explicitly points toward aggregated, differentially private attribution reporting, which is a clear sign that the industry is moving toward privacy-safe measurement rather than individual-level tracking (W3C privacy-preserving attribution draft). Independent coverage has also noted that Google announced the retirement of multiple Privacy Sandbox technologies in October 2025, which is another reminder that browser-centric assumptions won't stay stable for long. For creators, the takeaway is simple, build systems that survive partial visibility instead of pretending exact paths will come back.
A better panel combines platform-native metrics with first-party signals you control. Use UTM-tagged links to a newsletter or landing page, a short vanity URL, and server logs that record the referrer when traffic reaches your site. Then calculate ratios like follows per profile visit and repeat visitors per unique session, rather than pretending you can reconstruct every user's journey.
Write down what you can't see
You won't fully capture cross-device behavior. Logged-out duplicates will blur some counts. Bot traffic can creep into platform totals. None of that means the data is useless, it means the assumptions need to be stated every time you report the result.
When multiple platforms claim the same action, external attribution systems should treat it as one conversion and distribute credit instead of double-counting it, which is the logic practitioners use to avoid inflated numbers (independent attribution guidance). That's the right mindset for creator analytics too. You're not trying to prove every path perfectly, you're trying to compare enough evidence to make the next post smarter.
The goal is not precision theater. It's a weekly panel that helps you see whether the account is producing real audience movement or just noisy platform activity.
A Two-Week Setup Plan You Can Run Today
A good setup starts with a real workflow, not a dashboard full of hopeful charts. Use two weeks, spend the first on measurement, and the second on one test you can defend when the numbers get messy. That is the difference between tracking that teaches you something and tracking that only looks active.
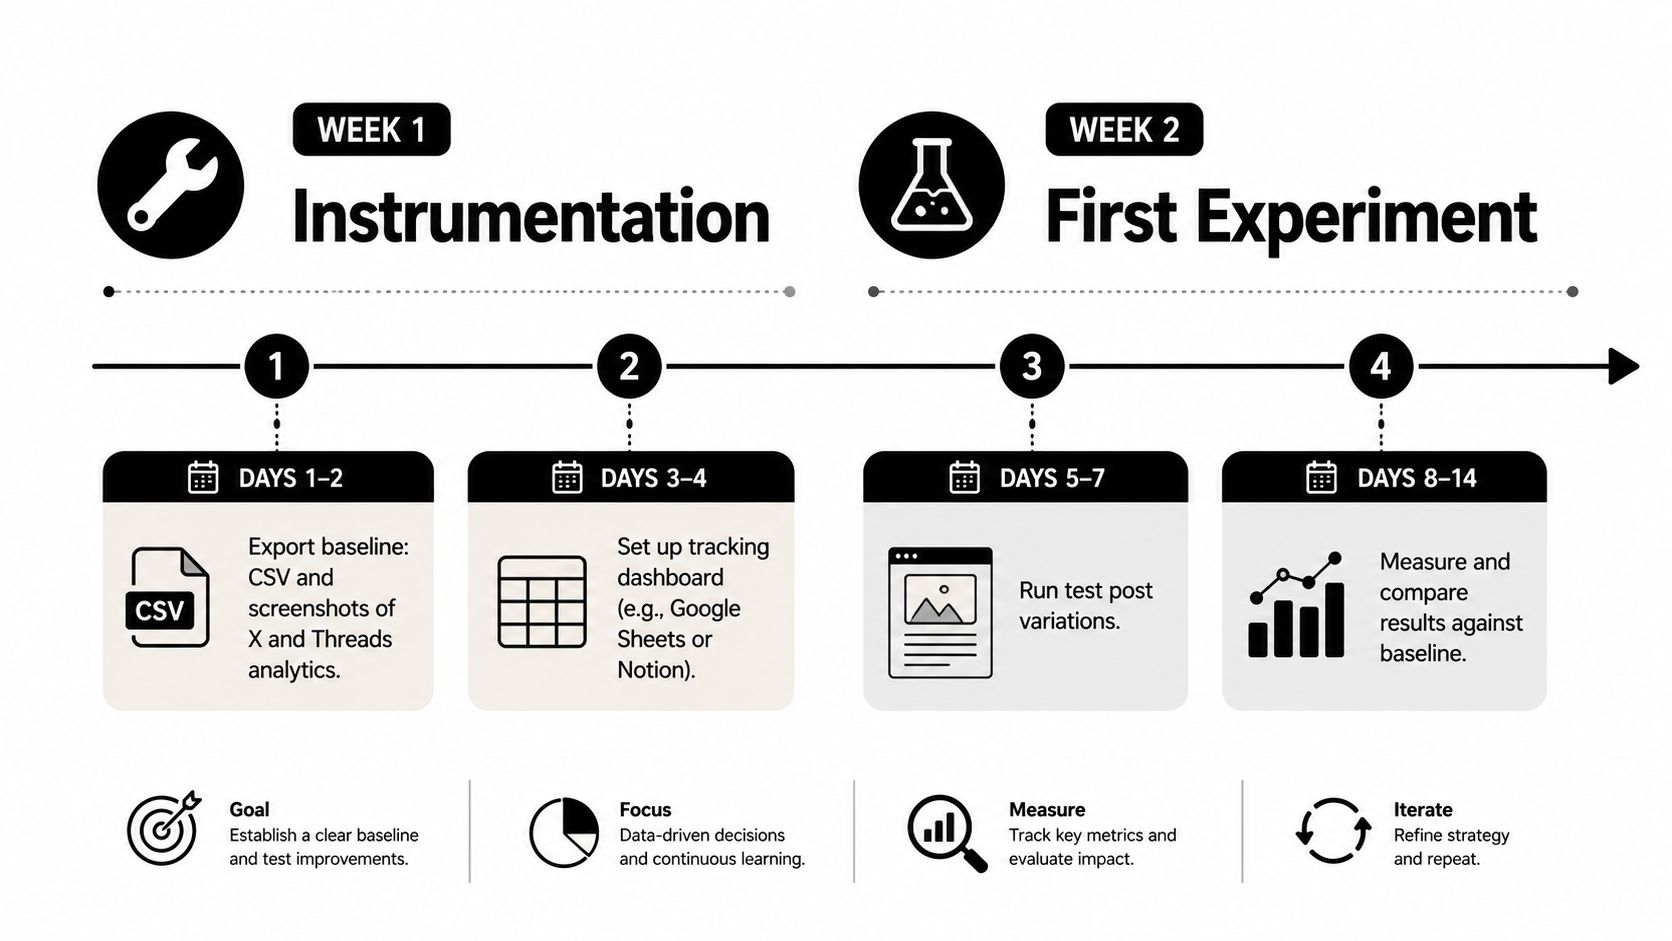
Week one, get the spine in place
Days 1 to 2: export your current X and Threads analytics into a baseline CSV, then screenshot the dashboards so you can compare later. The point is not elegance. It is a reference point you can trust when the account starts changing.
Days 3 to 4: route your post links through one vanity redirect with UTM parameters, then set up a simple event log in Sheets or SQLite. Record date, post type, profile visits, new follows, and repeat visits. If you need a cleaner checklist for whether the account is being throttled or just behaving oddly, pair this with a shadowban check before you trust a weak week.
Day 5: write a short tracking brief that defines your three core signals in plain language. If a teammate cannot read it and restate the definitions, the setup is still fuzzy.
Day 6: build a one-page dashboard that plots follows per visit and repeat-visit rate over time. Keep it simple enough to scan in a minute, because a more elaborate view usually just hides the part you need.
Day 7: review the baseline and pick one hypothesis. One variable, one change, one outcome.
Week two, test one thing
Days 8 to 10: publish the test against the holdout. Keep the rest of the cadence steady so you can tell whether the change matters.
Days 11 to 13: collect and clean the data. Fix obvious logging errors, then leave the awkward results alone unless you can explain them.
Day 14: write a short retro with the effect you saw, the decision you're making, and the next test you'll run. The goal is not to fill a folder. It is to build a habit of better decisions.
Closing the Loop Between Tracking and Better Drafts
Tracking only matters if it changes next week's draft brief. A weekly review should pull the last seven posts, group them by topic, format, and posting time, and produce one sentence per cluster about what the data seems to reward. That sentence becomes the input for the next week's writing plan.
Turn the signals into editorial choices
If a cluster produced strong profile visits but weak follows, the profile or CTA probably didn't make the account promise clear enough. If follows were healthy but repeat visits sagged, the content may have attracted the right audience but not the right cadence. If repeat visits were good and discovery was weak, the next post needs a stronger hook or a different distribution angle.
A useful draft brief stays short:
- Hypothesis: what change should move the signal
- Audience cue: who the post is for
- Format: thread, short take, reply, or a sharper bio-led post
- Decision metric: the one signal that decides whether it worked
A 90-day archive of those briefs becomes a personal benchmark library. Slow weeks stop feeling like failure, because you can compare them to your own baseline instead of chasing somebody else's numbers. That archive is also where a tool like Yubook fits naturally, since it connects profile visits to follow conversion and keeps predicted performance separate from actual outcomes, which is useful when you're trying to learn from the gap rather than ignore it.
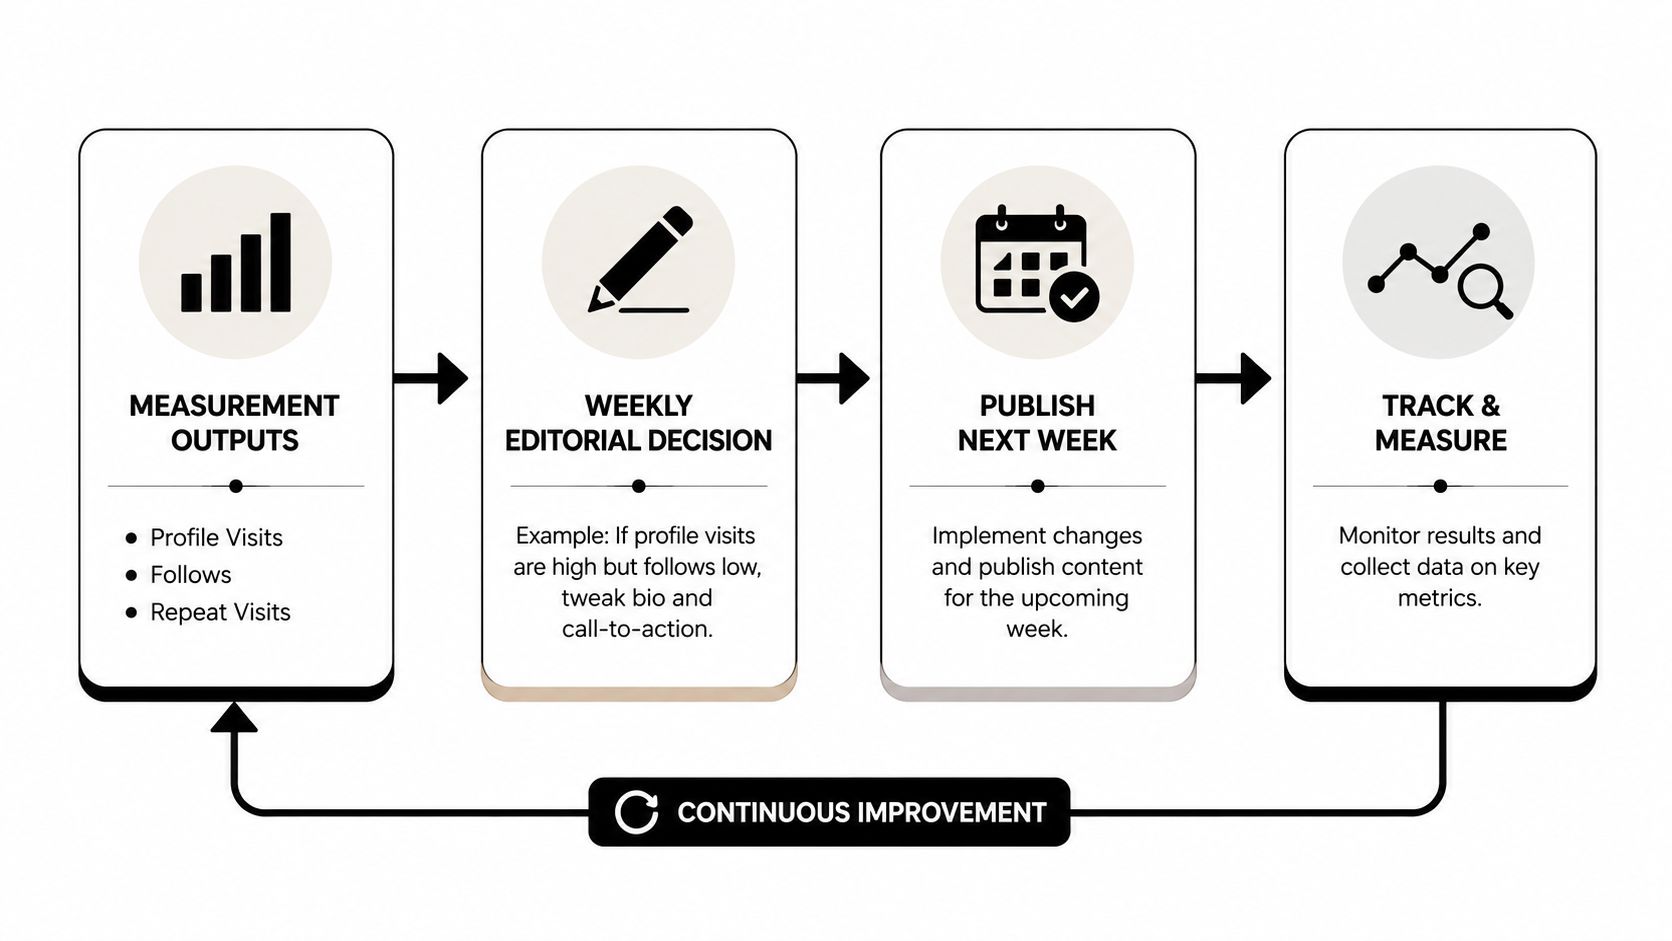
The win is not a prettier dashboard. It's a draft process that gets better because the measurement loop is tight enough to teach you something every week. Write the next post from your own data, not from the hope that the algorithm will make sense of it for you.
If you want a publishing workflow that ties profile visits, follow conversion, and post-level learning together, start using Yubook as the measurement layer for your X and Threads drafts. It's built for creators and small teams that want clearer feedback on what turns attention into audience growth, and it keeps predicted performance separate from what happened after you published.