Social Media Forecast: A Practical Guide for Creators
Learn how a social media forecast works, what signals it tracks, and how creators on X and Threads can use probability ranges to publish
Upkeep · 2026-09-10 · 46 min
The most popular advice about a social media forecast is usually a list of trends: short-form video will grow, AI will change discovery, authenticity will matter more. Those observations may be useful for planning, but they don't answer the question creators face before publishing: what is this specific draft likely to do, and what should I change before it goes live?
That distinction matters because social media is already a mass environment, not an early-adopter experiment. DataReportal's mid-year global social media update estimated 5.79 billion social media user identities in 2026, equal to 69.9% of the world's population. The same update reported 294 million new identities in the previous twelve months, or 5.4% year-over-year growth. More people may join, but creators now compete inside crowded feeds where audience overlap, platform differences, and ranking signals shape every result.
A useful forecast therefore isn't a prophecy about next year's winning format. It's a practical estimate for one draft, expressed as a range, tested against what happened, and used to improve the next decision on X or Threads.
Table of Contents
- Why Most Forecasts Miss What Creators Actually Need
- What a Social Media Forecast Really Is
- The Signals Behind a Forecast Range
- How to Read a Probability Range Without Misreading It
- A Creator Workflow for Forecasting and Verifying Drafts
- Common Pitfalls When Acting on a Forecast
- Putting Forecasting Into Your Publishing Routine
Why Most Forecasts Miss What Creators Actually Need
A forecast that says “short-form video will remain important” may be directionally correct, but it doesn't help you decide whether to publish your draft this morning or tonight. It doesn't tell you whether the opening sentence is strong enough, whether a question will attract thoughtful replies, or whether a thread deserves another round of editing.
Public trend reports usually operate at the macro level. They discuss AI, video, search, authenticity, or platform adoption. That context helps a marketing team set priorities, yet a solo creator makes smaller decisions repeatedly:
- Rewrite the hook: Does the first line create enough curiosity to earn a pause?
- Choose the publishing window: Is the audience likely to be available when the draft appears?
- Change the format: Would a compact post invite more conversation than a long thread?
- Set the objective: Is the draft meant to earn replies, profile visits, clicks, or follows?
- Decide whether to promote: Does the likely upside justify additional effort?
The global audience makes those decisions more important, not less. DataReportal's 2025 global overview recorded 5.66 billion social media user identities, representing 68.7% of the global population, after the addition of 259 million identities in the prior year. That history shows why linear assumptions can mislead: a small rate of change applied to a very large base creates substantial potential reach, while intense competition makes that reach harder to capture.
The useful unit is the draft
A practical social media forecast starts with a specific piece of content. It asks what range of impressions, replies, profile visits, clicks, or follows this draft might produce, given the account's own history and the current context.
That framing also keeps prediction honest. A forecast doesn't promise success, and it can't remove news events, platform changes, audience mood, or random distribution effects. It gives you a clearer decision surface before publishing, then creates a reference point for learning afterward.
Practical rule: If a forecast doesn't change an editing, timing, or measurement decision, it's probably a trend summary rather than a working forecast.
What a Social Media Forecast Really Is
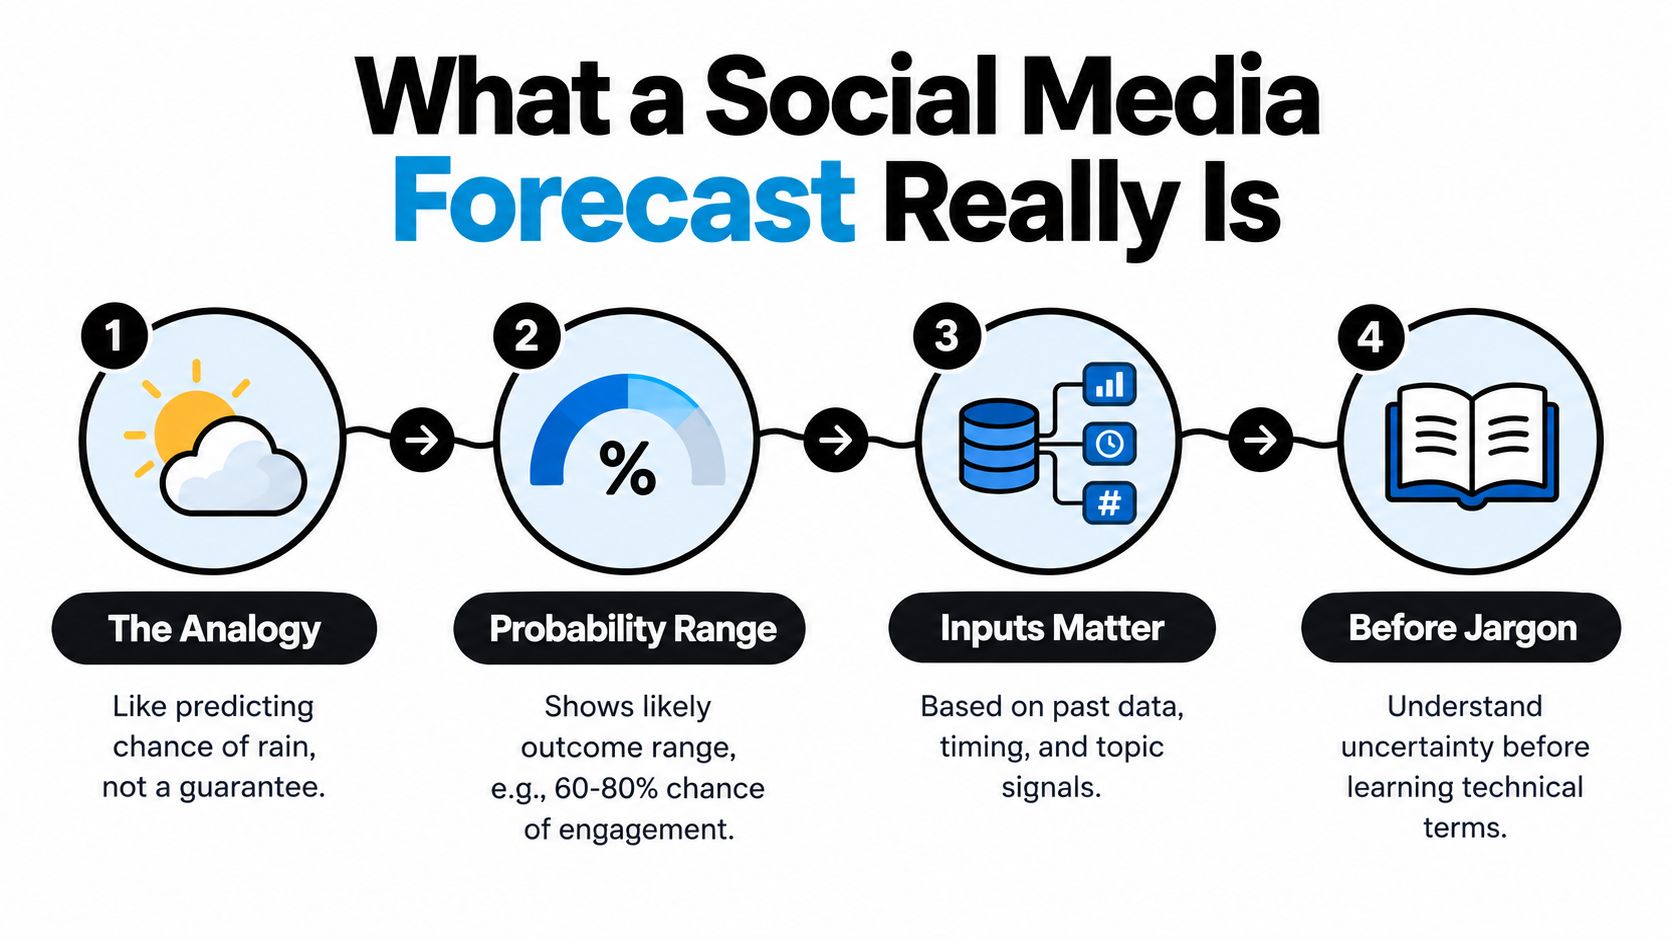
Think about a weather forecast for one afternoon. It doesn't claim that rain will definitely fall on your street at an exact minute. It gives you a probability, a likely range of conditions, and enough context to decide whether to carry an umbrella.
A social media forecast works in a similar way. It estimates the likely outcomes for one draft in one context, using signals such as:
- Past performance, especially posts with similar topics, formats, and audiences.
- Audience behavior, including whether readers tend to reply, share, save, click, or visit a profile.
- Current context, such as timing, topic freshness, ongoing conversations, and platform norms.
- Draft characteristics, including the hook, structure, question, call to action, and intended outcome.
Ranges are more useful than promises
A point prediction says, “This post will receive 2,000 impressions.” That sounds precise, but precision can be deceptive when distribution is noisy. A range says, “This draft is more likely to land somewhere between a lower and upper boundary.” The range acknowledges uncertainty while still supporting a decision.
The forecast can cover several outcomes:
- Reach: impressions or views generated by the initial distribution.
- Conversation: replies, quote posts, or comments.
- Interest: profile visits, saves, or repeat visits.
- Action: link clicks, sign-ups, downloads, or follows.
Each metric has its own uncertainty. A post might reach many people but produce little profile curiosity. Another might attract fewer impressions yet generate unusually thoughtful replies from the right audience. Measuring only reach hides that difference.
Separate prediction from measurement
The forecast is created before publication. The outcome is recorded after the post has had time to circulate. Those are different layers of evidence.
Public ranking signals can suggest how a platform may distribute a post. Measured outcomes tell you whether readers took the action that matters to your business or audience. Keeping those layers separate prevents a common mistake, treating a visible ranking cue as proof of conversion.
A good social media forecast therefore has three parts: a probable range, an explanation of the signals behind it, and a verification step. Without the third part, the number can't teach you much.
The Signals Behind a Forecast Range
A forecast becomes easier to use when you separate signals by the decision they support. Some signals help estimate whether a post will be discovered. Others indicate whether discovered readers will do something valuable afterward.
Reach signals
Reach signals influence the chance that a draft receives initial distribution. They may include:
- Posting time, compared with the account's historical activity windows.
- Format and length, such as a short statement, reply, list, or multi-post thread.
- Hook strength, judged by clarity, tension, specificity, and immediate relevance.
- Hashtag use, where relevant to the platform and conversation.
- Topic freshness, including whether the subject is already active in the surrounding feed.
These signals help answer, “How should I package and place this draft?” A timing tool such as Yubook's best-time guide can support that decision, but timing shouldn't override a weak opening or an audience mismatch.
Conversion signals
Conversion signals become important after someone has noticed the post. They include:
- Call-to-action clarity: Does the reader know what to do next?
- Question framing: Does the question invite a real answer rather than a reflexive reaction?
- Past reply depth: Has this audience previously written substantial responses on related topics?
- Audience intent cues: Do similar posts produce saves, link clicks, profile visits, or repeat visits?
- Context fit: Does the post match what people came to the account or conversation to discuss?
These signals help answer, “Is this draft worth deeper engagement?” A post designed to drive profile visits needs different evidence from one designed to start a debate. A forecast that combines both objectives into one score can make a strong reach result look like a business success even when nobody takes the intended action.
Platform weight changes the interpretation
X and Threads shouldn't be treated as interchangeable. An X forecast may place more emphasis on reply behavior, conversational adjacency, and the possibility of borrowing reach through responses. A Threads forecast may interpret saves, quote posts, and ongoing topic participation differently.
| Signal Category | Examples | Decision It Supports |
|---|---|---|
| Reach signals | Timing, format, length, hook, topic freshness | When and how to publish |
| Conversation signals | Questions, reply history, quote potential | Whether to invite discussion |
| Interest signals | Profile visits, saves, repeat visits | Whether the idea creates curiosity |
| Action signals | Link clicks, follows, sign-up intent | Whether the post supports a business goal |
| Risk signals | Negative feedback, dismissive replies, audience mismatch | Whether to revise or narrow the claim |
The signal weights should reflect the account's own history. A generic platform average may be interesting, but it can't replace evidence from your audience.
How to Read a Probability Range Without Misreading It
Suppose a draft receives a forecast of 1,200 to 3,400 impressions, with a 65% chance of reaching 1,800 or more. The point isn't to treat those figures as a promise. The point is to understand what each part tells you before deciding whether to publish.
The lower bound, 1,200, describes a plausible weaker outcome under the model's assumptions. The upper bound, 3,400, describes a plausible stronger outcome. The midpoint is a convenient summary of the center of the range, but it isn't a guarantee and shouldn't become your target by default.
The 65% threshold answers a different question. It says the forecast assigns a stated probability to reaching at least 1,800 impressions. It doesn't say the post will reach exactly 1,800, nor does it describe the probability of replies, clicks, or follows.
Wider ranges can be more honest
A forecast interval becomes wider when the underlying evidence is mixed or uncertain. A newer account, a new topic, an unusual format, or a small comparison set can make the estimate less stable. A longer confidence interval is not automatically a poor forecast. It may be a truthful signal that the model has less comparable evidence.
A narrower range doesn't guarantee certainty either. If the baseline is biased, the model can be confidently wrong. For example, a viral outlier may make future drafts appear stronger than the account's normal performance supports.
| Range Element | What It Means | Creator Decision Trigger |
|---|---|---|
| Lower bound | A plausible weaker result | Can the post still serve its purpose at this level? |
| Upper bound | A plausible stronger result | Is the upside worth extra editing or promotion? |
| Midpoint | A central summary of the range | Use it for planning, not as a promise |
| Probability threshold | The estimated chance of crossing a chosen outcome | Publish, revise, or change the objective |
| Confidence width | How uncertain the estimate is | Gather better comparisons before trusting the range |
Turn the range into an action
For an X draft, you might publish if the lower bound still supports your goal and the reply potential is strong. You might revise the hook if the entire range is weak, especially when comparable posts with clearer openings performed better. You might delay when timing appears unusual and the draft has no urgent context.
On Threads, you could accept a modest reach range if the draft is designed to earn saves or quote posts from a relevant audience. The decision depends on the outcome you forecasted, not the most visible number in the dashboard.
After publishing, record the actual result alongside the forecast. A result below the range doesn't automatically mean the idea failed. It may point to a timing mismatch, a weak first line, a context shift, or negative feedback that the reach estimate didn't capture.
A Creator Workflow for Forecasting and Verifying Drafts
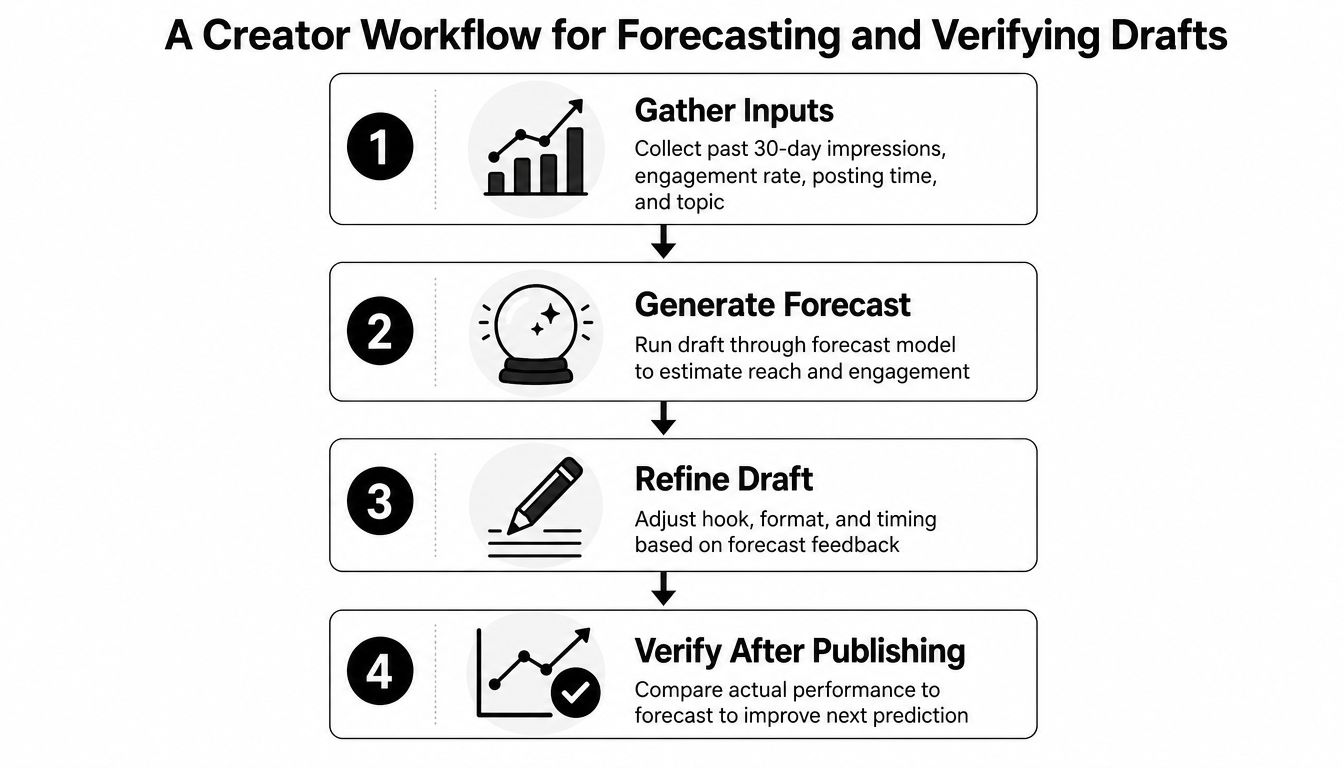
A solo creator can run a useful forecasting loop without turning every post into a research project. The workflow has four stages, and each stage should leave a record that the next forecast can use.
Stage one gathers comparable inputs
Start with a recent baseline. Collect the account's past thirty-day impressions, engagement rate, posting time, topic tags, and the draft text. The comparison set should resemble the draft, not merely include the account's most successful posts.
A founder writing about developer tools might compare the draft with earlier posts about the same audience and problem. A newsletter writer might separate practical tutorials from personal observations. Mixing unrelated formats creates a noisy baseline.
Stage two creates a range
Use those inputs to estimate likely reach and engagement with confidence bands. The forecast should explain which signals raised or lowered the range. If the draft has a strong topic match but an unclear call to action, the likely reach and likely conversion should be treated separately.
Stage three checks the draft
Before publishing, ask three practical questions:
- Does the draft fit the topic cluster? If the account usually serves a defined audience, does this post reinforce that expectation?
- Does the timing match prior strong windows? If not, is there a compelling reason to accept the added uncertainty?
- Can the hook be reused? A strong idea should teach you something that can inform future posts, even if this version underperforms.
A representative creator might discover that their forecasts consistently overestimate posts published outside familiar windows. Instead of abandoning the topics, they could keep the ideas, adjust the opening, and test a better publishing context.
Stage four verifies the result
Review performance after 24 and 72 hours, then record the forecast-versus-actual gap. Tag a likely cause, such as timing, hook, topic fit, reply quality, external news, or negative feedback. A performance review such as Yubook's views-dropped guidance can help structure that diagnosis.
The loop matters more than any single forecast. You can also use this embedded video as a practical complement while setting up the workflow:
If the actual result repeatedly falls below the range, recalibrate the baseline or reduce the weight assigned to optimistic signals. If results exceed the range, look for the specific factor that changed, rather than raising every future estimate.
Common Pitfalls When Acting on a Forecast
Forecasting doesn't remove judgment. Used badly, it can make creators less distinctive and less attentive to audience quality.
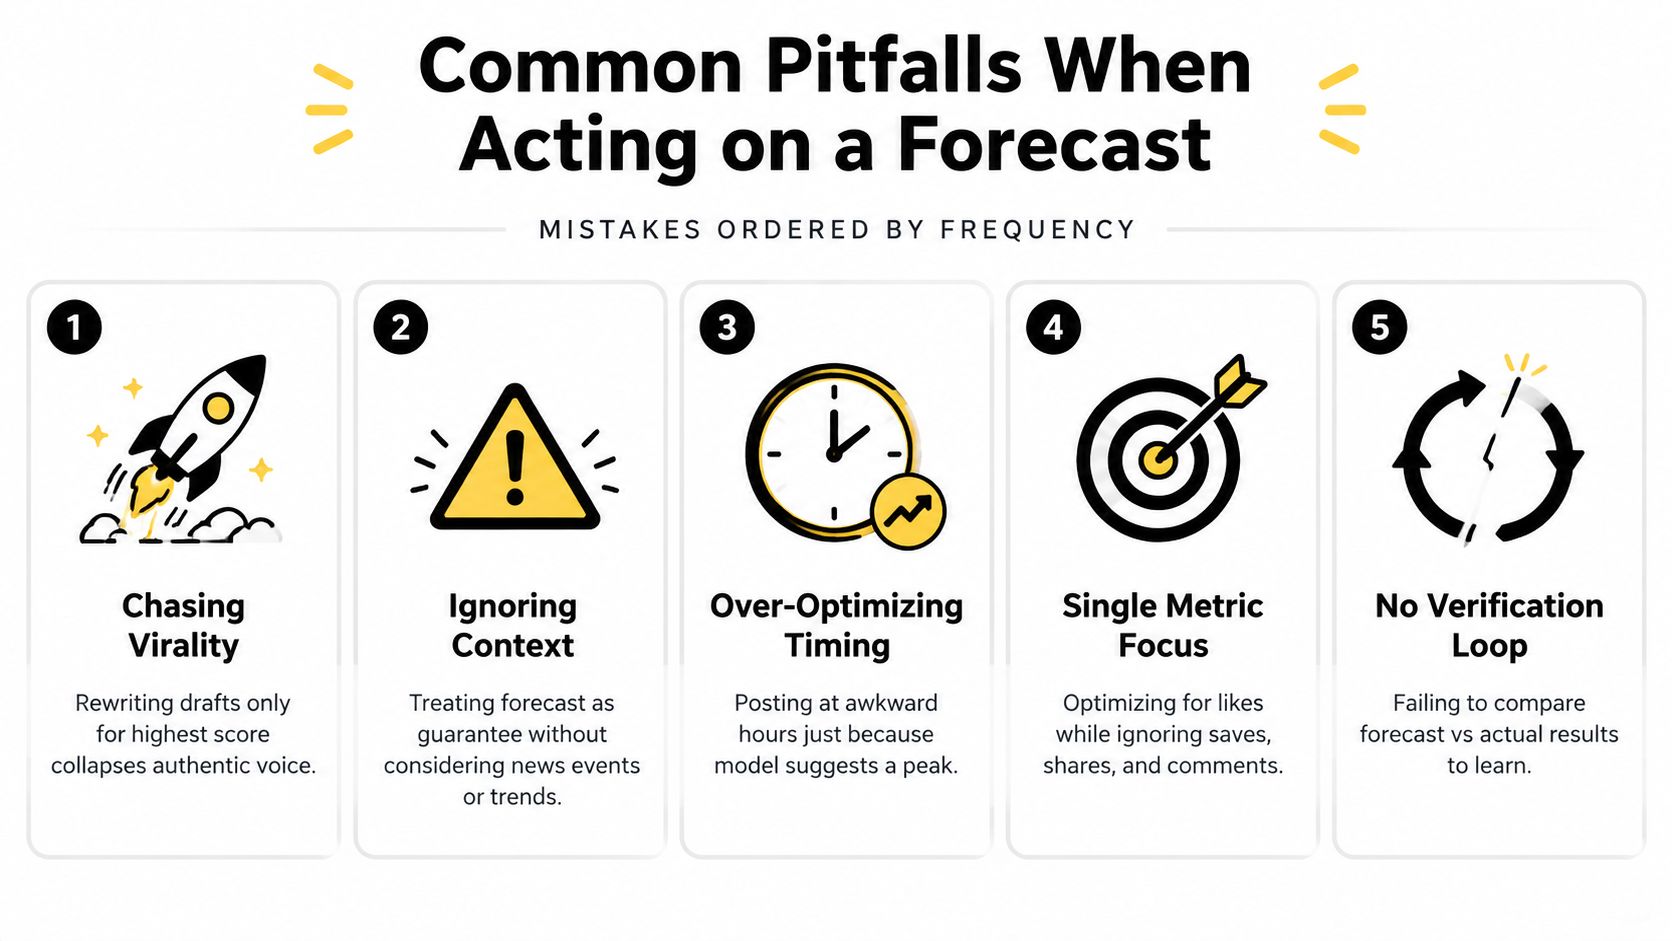
The mistakes that cause the most damage
- Chasing the highest score: Rewriting every draft toward the format a model rates most highly can flatten your voice. A forecast should expose trade-offs, not replace your point of view.
- Ignoring negative feedback: A reach-only estimate may miss dismissive replies, hostile sentiment, unfollows, or ratio replies. Those signals can matter more than additional impressions.
- Treating the midpoint as a promise: A post below the midpoint hasn't necessarily failed, and a post above it hasn't automatically revealed a repeatable formula.
- Using a viral outlier as the baseline: One exceptional post can distort future ranges upward. Compare similar posts and keep unusual events labeled.
- Skipping verification: Without a forecast-versus-actual review, the number becomes decoration. You won't know whether the issue was the draft, the timing, the model, or the context.
A forecast should help you make a better decision, not pressure you into publishing content you wouldn't stand behind.
Context can overturn a clean estimate
A forecast is based on available signals. Breaking news, a platform feature change, a sudden controversy, or a major conversation can alter distribution after the estimate is created. That doesn't make forecasting pointless. It means you should record the context when the outcome differs sharply from the expected range.
The same caution applies to timing. A suggested peak window may be useful, but posting at an awkward hour can be the right choice when the conversation is urgent. Optimize for the goal and the audience, not for a clock reading alone.
Don't confuse popularity with value
Likes and impressions are visible, but they aren't always the intended outcome. A smaller post can create profile visits, qualified replies, or repeat readers. If your forecast tracks only reach, it may reward content that attracts attention without building an audience you can serve again.
A stronger review asks whether the post produced the action connected to its purpose. That might be a thoughtful reply on X, a save on Threads, a profile visit, or a click to a relevant resource.
Putting Forecasting Into Your Publishing Routine
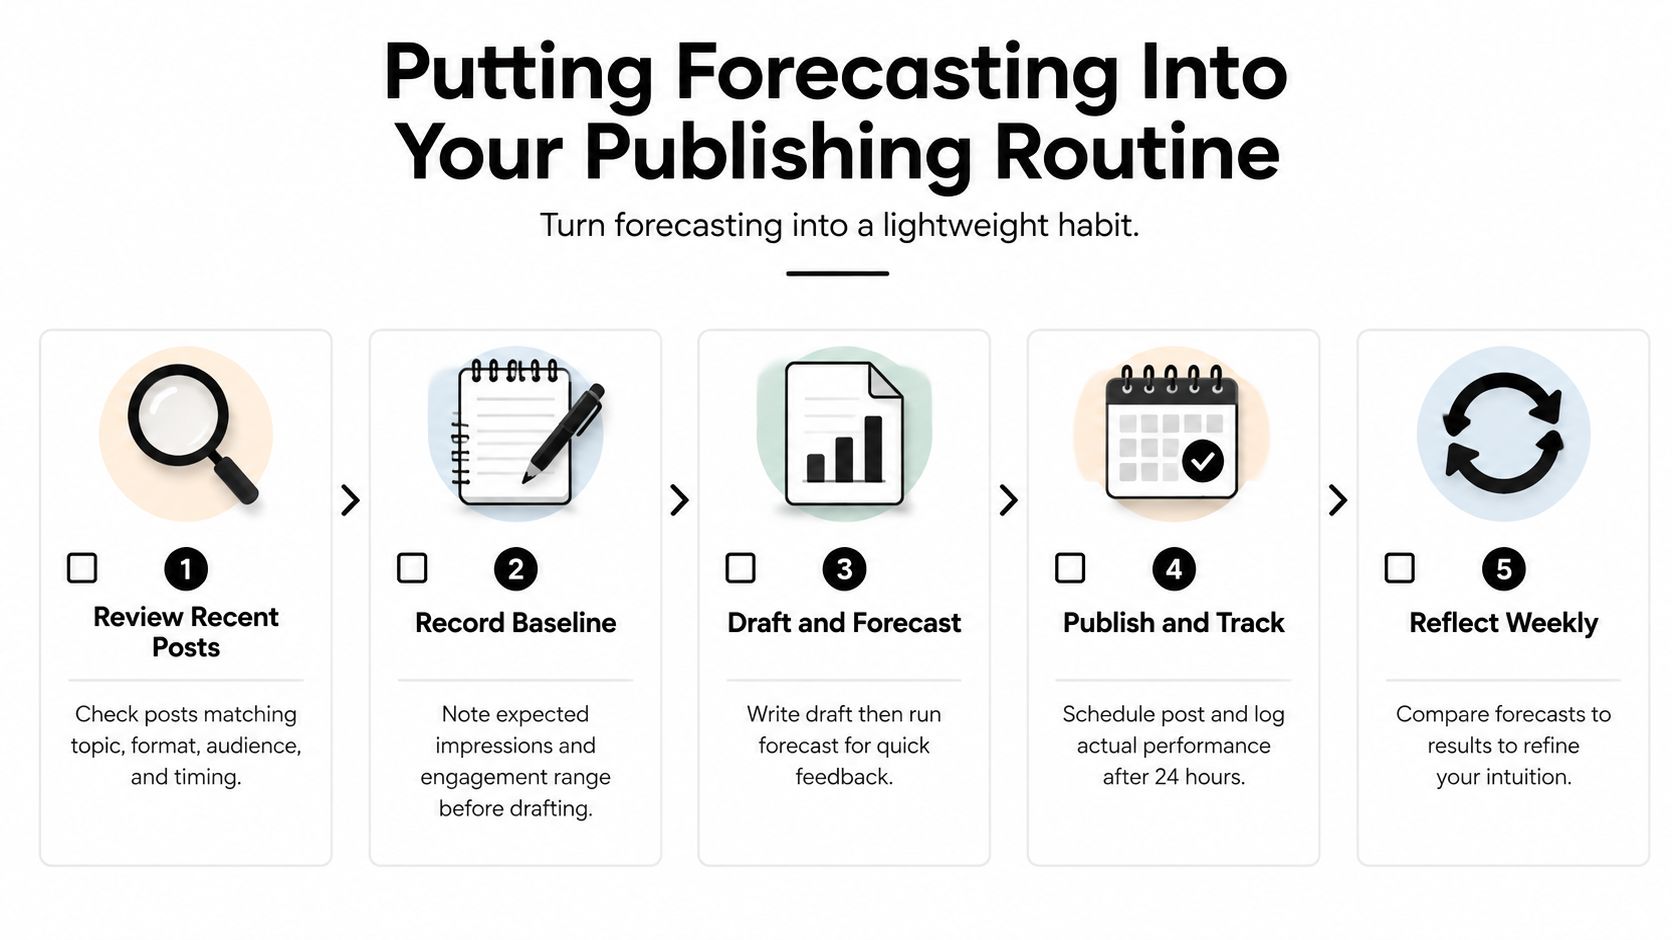
Forecasting works best as a lightweight publishing habit, not as a last-minute scoring ritual. Before drafting, review recent posts that match the proposed topic, format, audience, and timing. Then write down the expected reach range and the one action signal that matters most for this post.
A simple operating checklist
- Review comparable posts. Look for similarity in topic, format, audience, and context. Don't use the account's biggest post as the automatic benchmark.
- Record a baseline. Note the likely range and the outcome you care about, such as profile visits, replies, clicks, or follows.
- Draft and forecast. Write the post, assess the hook and call to action, then use the forecast to identify a specific revision.
- Publish and observe. Use Yubook's when-to-post resource as one timing input, but keep the final decision tied to the draft's purpose.
- Verify and reflect. Compare the result with the predicted range after the chosen observation window, then log one lesson.
A basic content record can contain the draft, date, platform, forecast range, actual outcome, context note, and one change for the next test. Review it regularly. If the ranges are consistently too wide, you may need more comparable examples. If they're consistently too optimistic, your baseline may contain outliers or your model may overvalue visible reach signals.
Keep the hypothesis visible
Publish because you have a testable idea, not because the forecast guarantees success. For example, your hypothesis might be that a sharper question will increase thoughtful replies, or that a clearer profile promise will improve the relationship between profile visits and follows.
On X, the experiment may focus on reply depth and profile curiosity. On Threads, it may focus on saves, quote posts, or repeat discussion. The platform changes, but the discipline stays consistent: forecast deliberately, publish one test, verify the outcome, and carry the lesson forward.
Weekly review: Keep the forecast, actual result, cause tag, and next adjustment in the same record. Calibration improves when your future decisions can see your past assumptions.
Yubook provides a browser-based draft studio, explainable forecast ranges from public X signals, cross-platform publishing to X and Threads, and performance replay that compares predictions with actual outcomes over time. Visit Yubook to turn your next draft into a measurable forecast-and-verification experiment.