The Fastest Way to Keep Your Users Informed: Continuous Uptime Monitoring and Live Status Pages
Product signals in one pulse
Upkeep · 2026-08-23 · 12 min
The Fastest Way to Keep Your Users Informed: Continuous Uptime Monitoring and Live Status Pages
In web development, SaaS, and API-driven services, micro-downtime or sudden unexpected latency is an inevitable reality. Server overloads, unexpected database spikes, memory leaks, or third-party service provider outages happen to even the best engineering teams.
When an incident occurs, the critical differentiator between losing user trust and maintaining standard credibility is transparency. How quickly can you detect an issue, and how effortlessly can your users check your system's operational health?
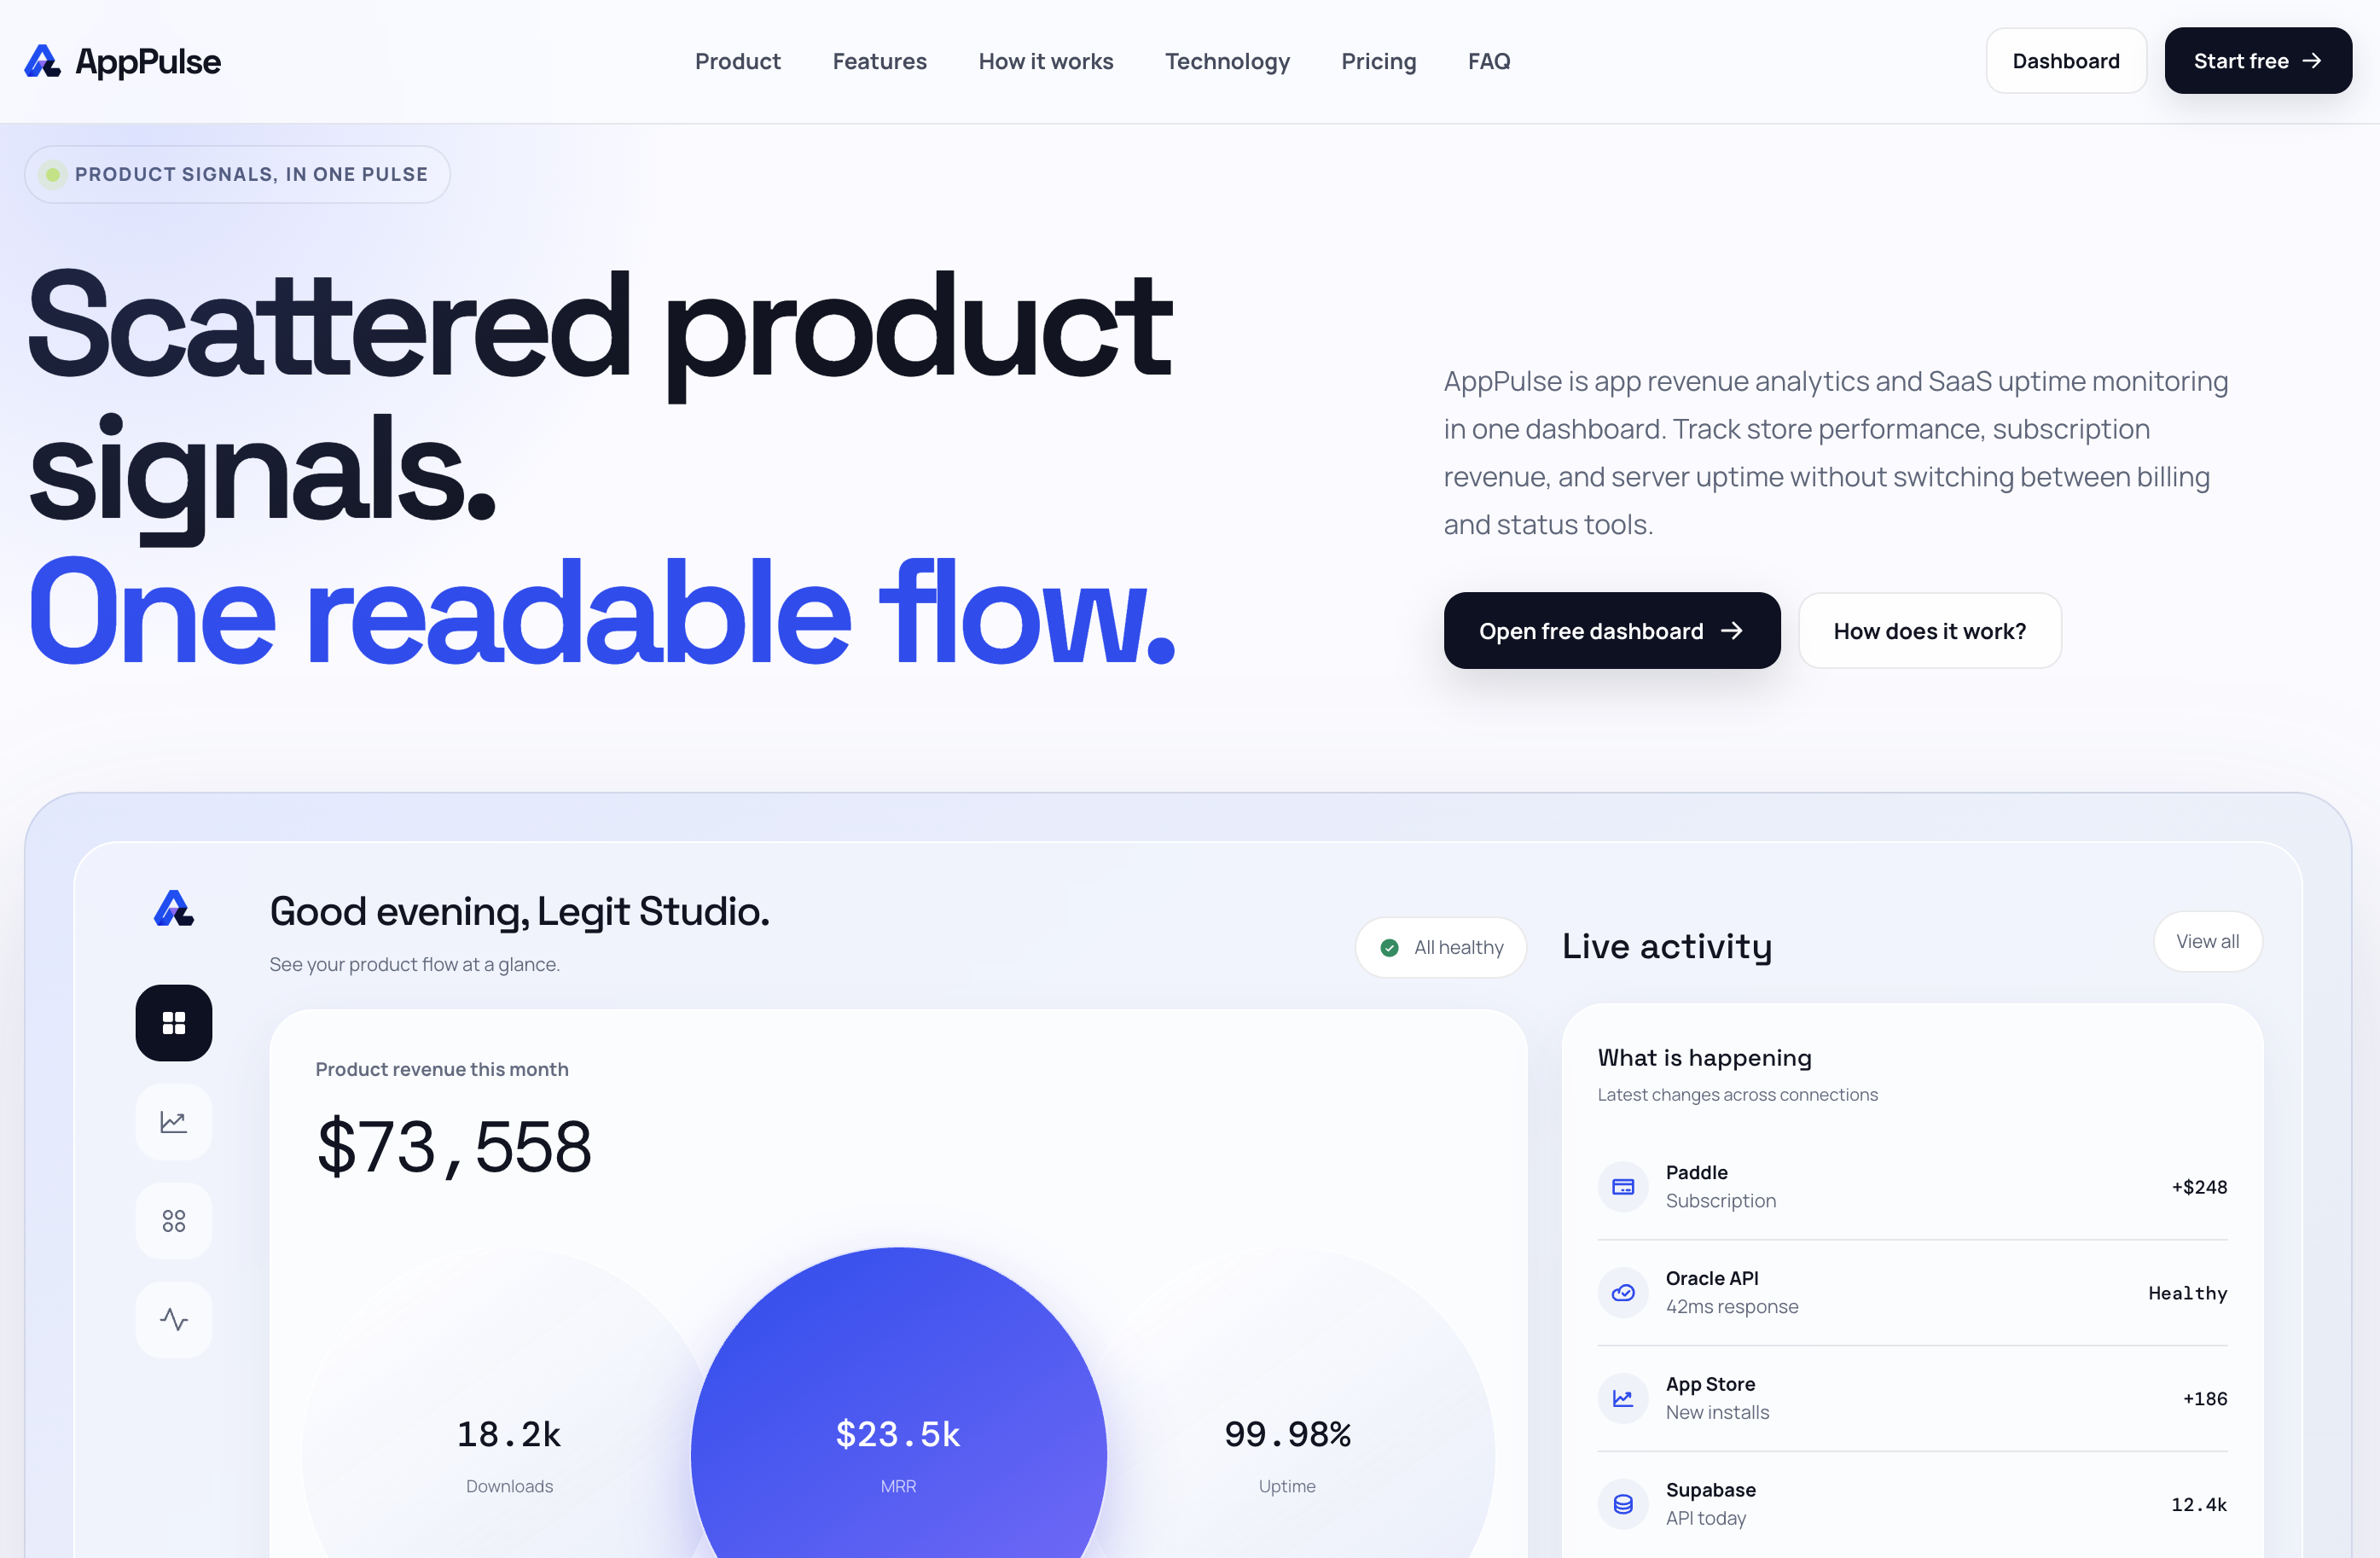
If users encounter a spinning loading wheel or a generic 502 Bad Gateway error, their immediate reaction is frustration, followed by support tickets or negative posts on social media. The fastest, most effective way to communicate server status and build immediate transparency with your user base is by leveraging a streamlined monitoring and status page platform like AppPulse.
Why Instant Status Communication Matters
Providing real-time visibility into your infrastructure offers distinct advantages for both product development and customer operations:
- Drastic Reduction in Support Tickets: During an outage, users seek immediate clarity. A public, accessible status page gives them an instant answer before they reach out to your support team.
- Building User Trust Through Transparency: Showing real 90-day uptime metrics demonstrates accountability and confidence in your service stability.
- Proactive Engineering Visibility: Automated monitoring detects performance degradation and outages immediately, allowing developers to address latent issues before they cascade across the entire system.
- Simplified Operations: Having a dedicated third-party hosted status page ensures that even if your primary web servers or application dashboards go offline completely, your status communication channel remains 100% operational.
Key Features of AppPulse Monitoring & Status Pages
AppPulse is designed to provide clean, real-time status reporting without clutter or complex setup barriers. By combining automated health checks with slick, readable status dashboards, AppPulse simplifies operational monitoring for developers, site owners, and SaaS operators.
       +------------------------------------+
       |       Your Web Application         |
       +------------------------------------+
                         |
                         | Periodic Health Checks
                         v
       +------------------------------------+
       |          AppPulse Engine           |
       |  - Tracks Uptime %                 |
       |  - Measures Latency (ms)           |
       |  - Logs Historical Outages         |
       +------------------------------------+
                         |
                         | Real-time Updates
                         v
       +------------------------------------+
       |    Public Status Page Dashboard    |
       |  - Operational Status Indicators   |
       |  - Interactive 90-day Calendar     |
       +------------------------------------+
1. Real-Time System Status & Overall Health Indicators
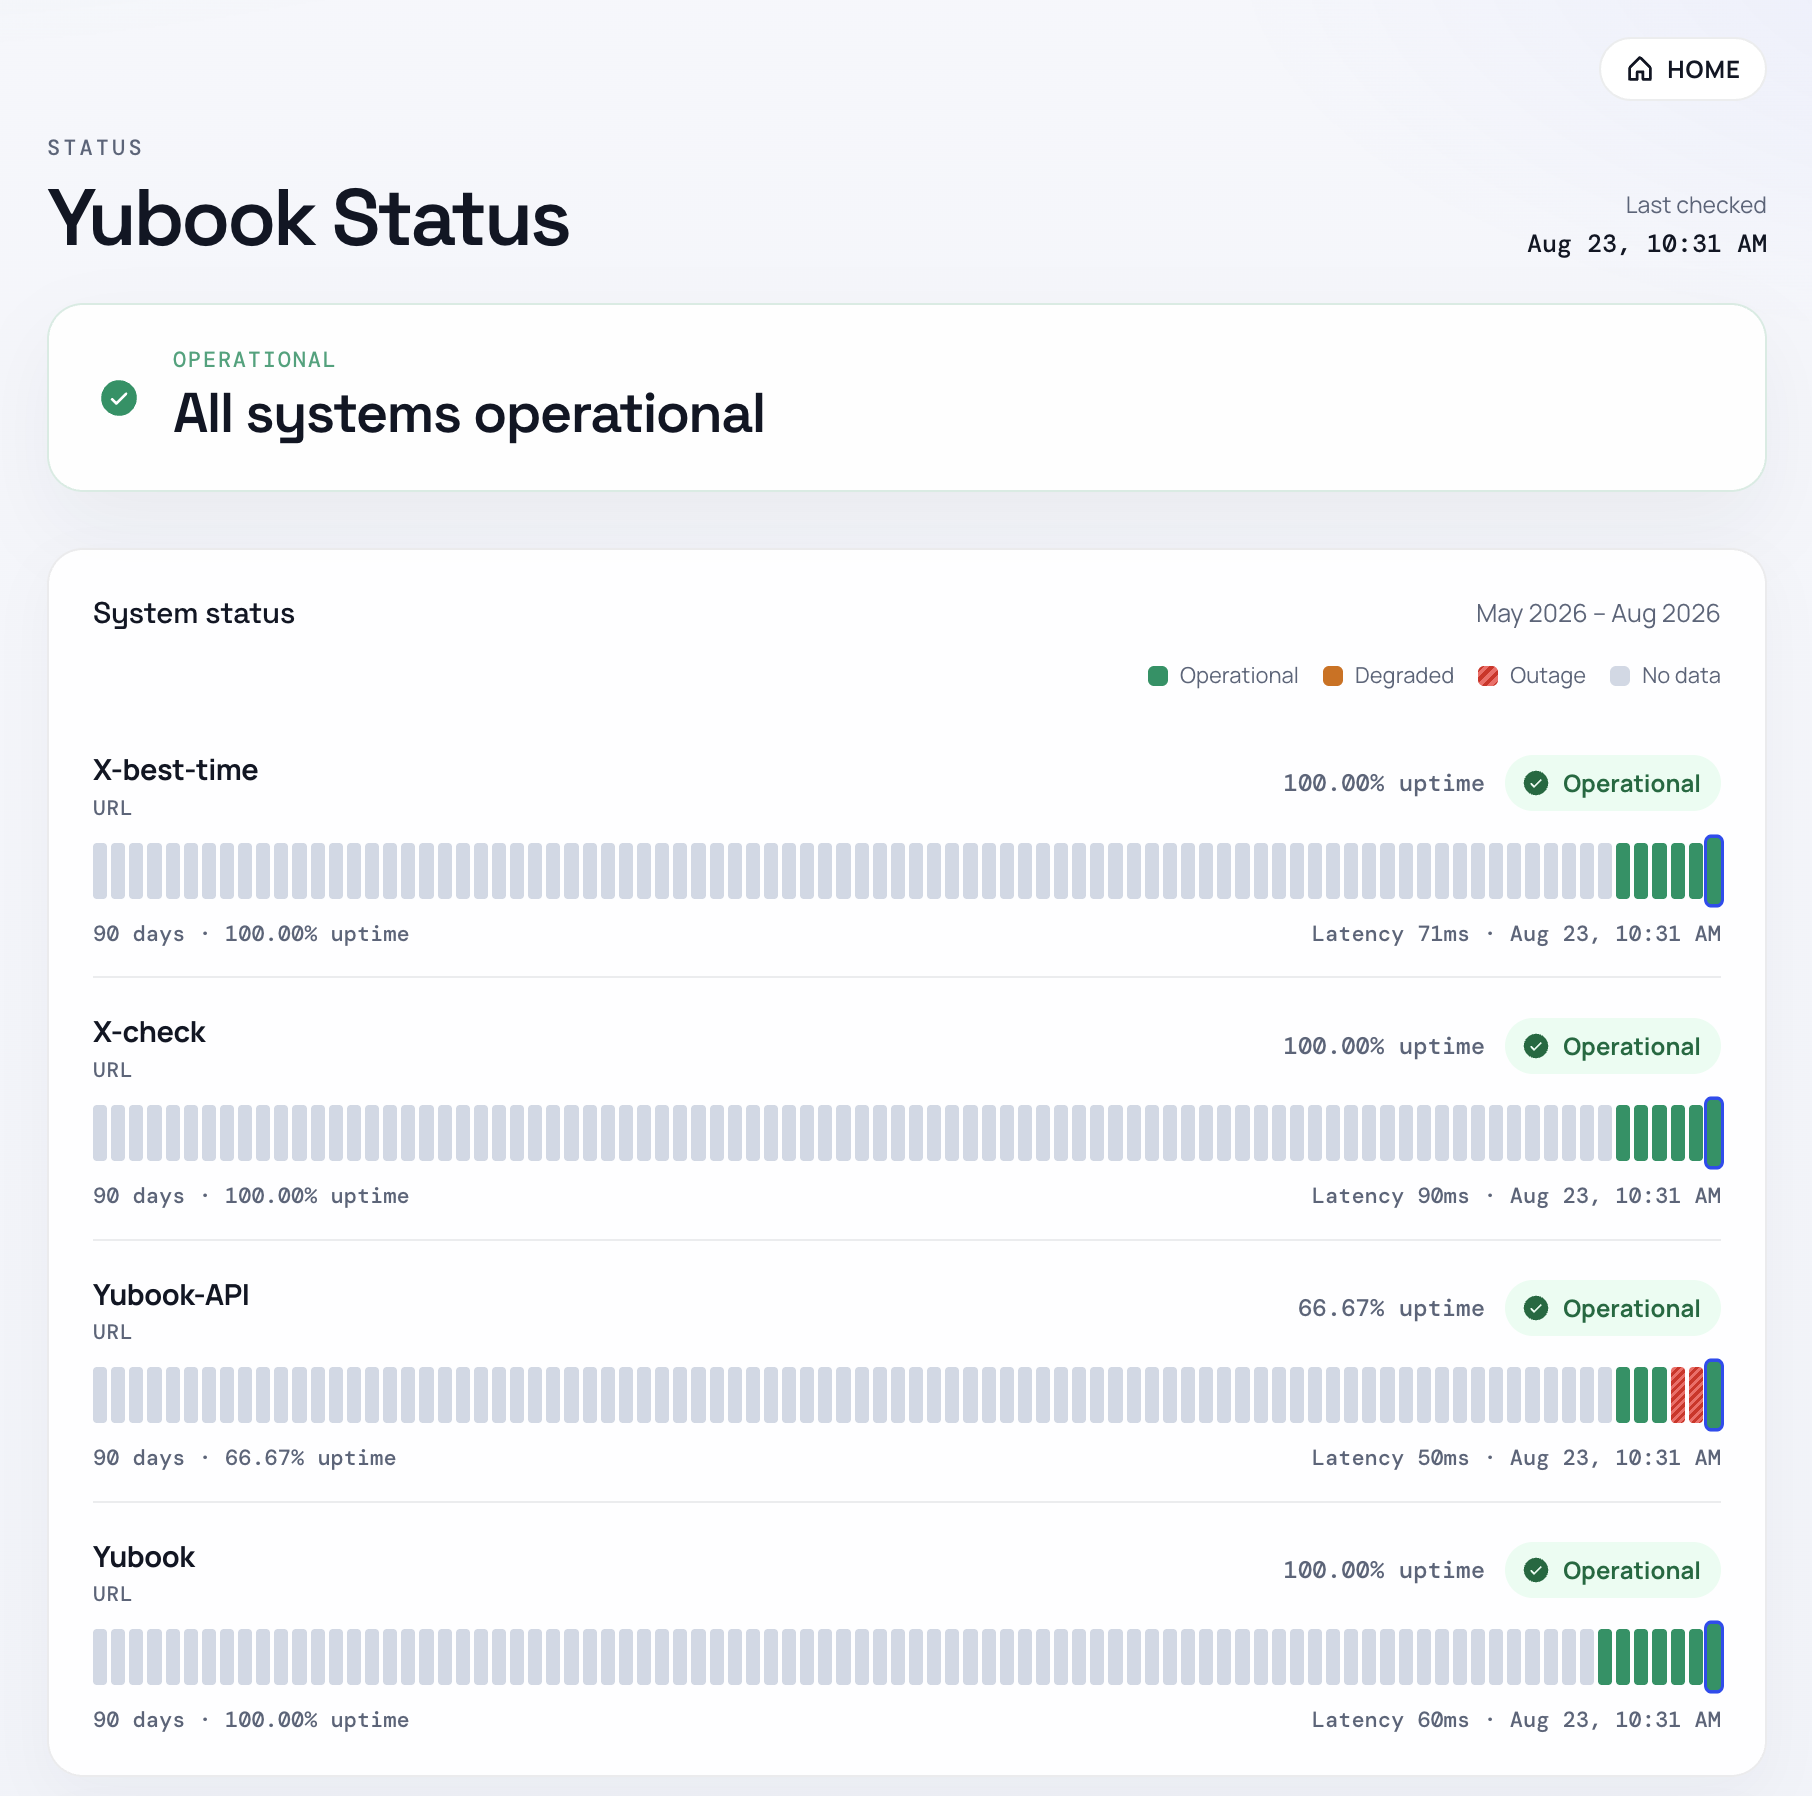
At the top of every AppPulse dashboard is an immediate global health summary banner (e.g., "All systems operational"). Users instantly know whether everything is running smoothly without needing to decipher complex logs or charts.
2. Micro-Level Service Breakdown
Whether your product relies on web frontends, backend APIs, specialized database workers, or specific microservices, AppPulse breaks down monitoring by individual endpoints:
- Endpoint Tracking: Monitor individual URLs and APIs independently (e.g., main landing site, checkout endpoints, authentication servers, core REST APIs).
- Latency Measurements: Monitor millisecond response times across services (e.g., tracking low-latency 50ms to 90ms target windows) to spot degradation before a full outage occurs.
- Precise Uptime Percentages: Display exact uptime stats over a rolling 90-day window (such as 100.00% operational health).
3. Historical Visual Bar Charts and Incident Calendars
Transparency requires historical context. AppPulse provides granular visual bars mapping daily performance over the past 90 days.
- Color-coded States: Differentiate operational states at a glance—Green for Operational, Orange for Degraded Performance, Red for Full Outages, and Grey for No Data.
- Interactive Daily Breakdown: Users can interact with the calendar view to inspect specific dates and review past incident logs or scheduled maintenance windows.
Quick Comparison: In-House Status Pages vs. AppPulse
| Feature / Metric | In-House Built Status Page | AppPulse Status Platform |
|---|---|---|
| Setup Time | Days to weeks of custom development | Minutes to configure via web dashboard |
| Outage Resilience | Fails if your primary infrastructure drops | Hosted independently on reliable infrastructure |
| Maintenance Overhead | High (requires ongoing fixes and updates) | Zero maintenance |
| Metrics Tracked | Manual implementation required | Automatic response latency, uptime %, and history |
| Public Visibility | High setup cost for custom dashboards | Clean, modern public-facing URL generated instantly |
How to Set Up Your Status Page in 3 Simple Steps
Getting your infrastructure status public and transparent takes only a few minutes with AppPulse:
- Register Your Endpoints: Add the core URLs and APIs that power your site or SaaS application into the dashboard.
- Configure Health Checks: Set monitoring intervals to track HTTP response codes and latency continuously.
- Publish Your Public Status Link: Share your clean AppPulse Status Page on your site footer, customer help center, or social profiles so users can check service health instantly anytime.
Conclusion
Keeping users informed about server status shouldn't require complex engineering or heavy custom code. By adopting AppPulse to host your status page and track system uptime, you can provide real-time clarity, build long-term trust, and reduce customer support overhead during unexpected disruptions.