Twitter Analytics Tools: 10 Best Platforms for Growth
Compare 10 Twitter analysis tools and analytics platforms, including twitter growth tool picks, twitter search analytics, and reporting for X.
Upkeep · 2026-08-22 · 53 min
The usual advice is to pick one "best Twitter analytics tool" and expect a single dashboard to answer every growth question. In practice, different users need different things. A creator may want drafting help, reply opportunities, and follower conversion signals. A marketing team may care more about reporting, competitors, audience segments, campaign history, or API access.
This comparison looks at each option through four practical lenses: X analytics depth, reliance on platform or programmatic data access, cross-platform measurement, and whether the tool supports forecast-versus-actual learning instead of only retrospective reporting. The tools here serve different jobs, including scheduling, management, reporting, benchmarking, audience intelligence, and campaign tracking.
Table of Contents
- 1. Yubook
- 2. Typefully
- 3. TweetHunter
- 4. ilo
- 5. Metricool
- 6. Sprout Social
- 7. Rival IQ
- 8. Audiense
- 9. SocialDog
- 10. Tweet Binder
- Top 10 Twitter Analytics Tools Comparison
- Choose the Tool That Matches Your Measurement Loop
1. Yubook
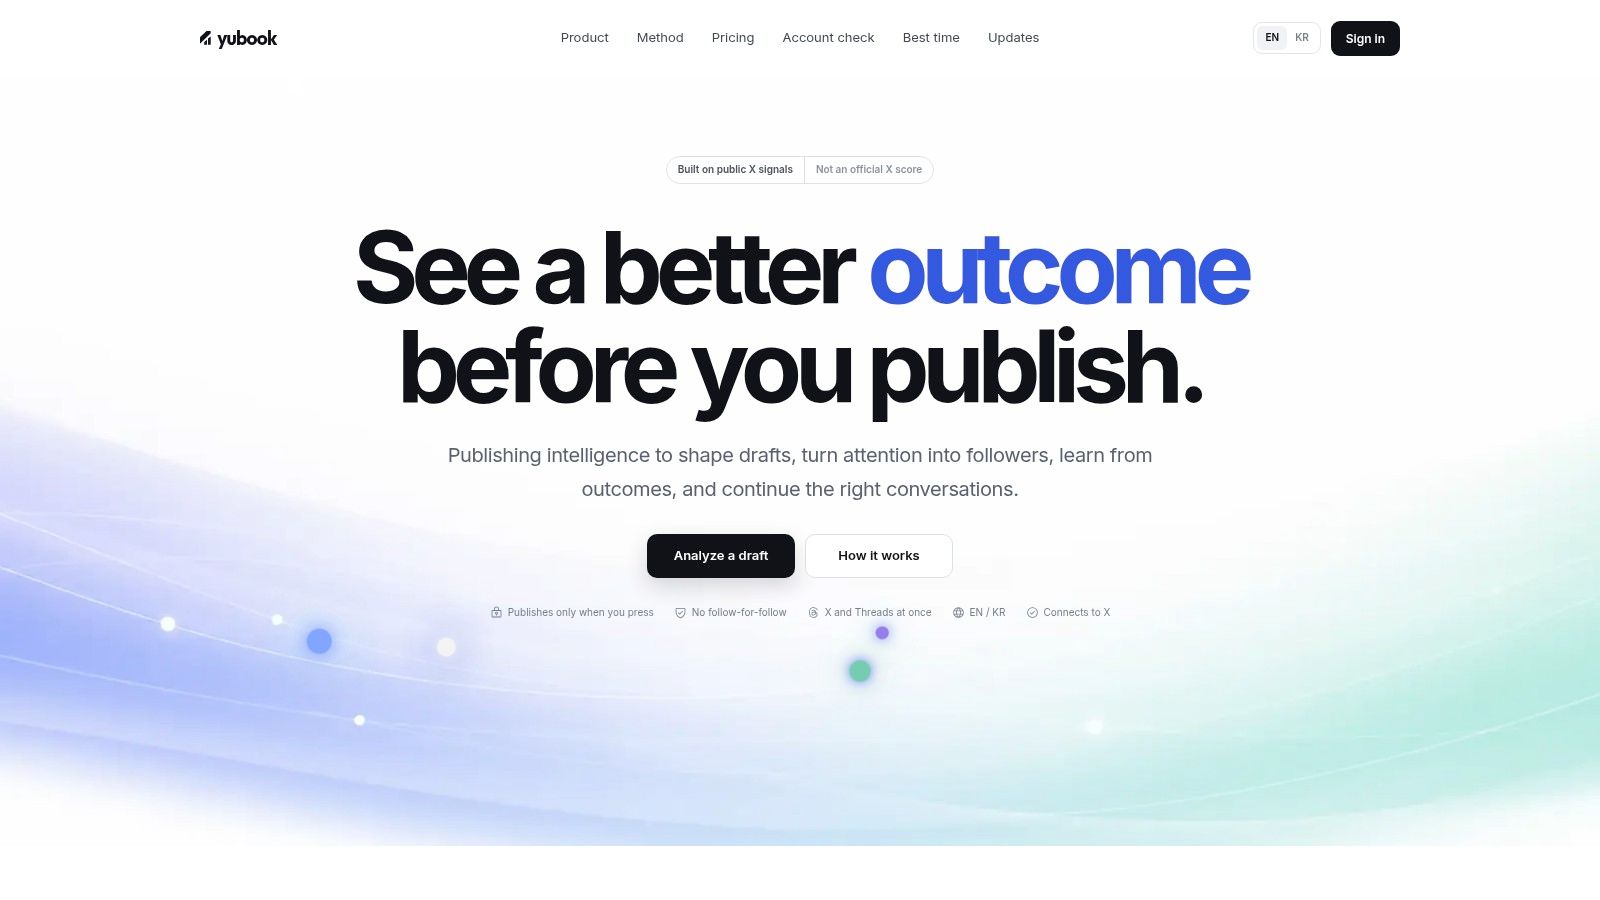
Yubook is designed for workflows where analytics can shape a post before publication, not only explain results afterward. Its browser-based draft studio analyzes writing on the user's device, suggests AI-assisted rewrites based on public signals, and produces an explainable forecast range for likely reach. It is not presented as an official X score.
That changes the workflow. A retrospective dashboard shows which post worked. Yubook helps assess whether a draft may need a clearer hook, stronger sharing value, or a better reply path before it goes live. Its recommendations separate cues like replies, shares, clicks, and negative feedback instead of compressing them into a single opaque score.
Why its measurement loop is different
Yubook supports one-click publishing to X and Threads with unified measurement. Its reply-target queue ranks conversations where a relevant response may attract more readers. A seven-day follower-growth sprint treats posting as staged experiments, while audience analytics connect profile visits with follow conversion and repeat visits.
A more distinctive feature is performance replay. Forecasts can be compared with actual performance over 72 hours to all time, then account-specific pattern memory and timing guidance can inform later decisions. Because forecasts are probabilistic, calibration works best with a connected account, recorded outcomes, and consistent testing.
Practical rule: Use the forecast as a decision aid, then use the replay as calibration evidence. Neither replaces first-party measurement.
Yubook relies on public X signals and does not present an official platform score. Its workflow centers on browser-based drafting, essential cookies, cookieless visit counting, and support for English and Korean. Product plan information lists pricing at $7.90 per week or $69.90 per year, with payments handled by Paddle. It may suit independent creators, founder-led teams, newsletter writers, social managers, and content strategists who want pre-publish guidance tied to later results.
2. Typefully
Typefully is built for creators and small teams that want drafting, scheduling, and X analytics in one workspace. Its reporting covers post and follower performance, growth, impressions, engagement, top posts, suggested posting times, and weekly or monthly rollups.
Its main advantage is workflow speed, not analytical breadth. A solo operator can inspect a strong post, check the account trend around it, and apply the lesson to a new thread. The trade-off is limited audience intelligence and little support for competitor or agency benchmarking. Typefully reports what happened after publishing. It does not focus on pre-publish forecasting or prediction replay.
Where programmatic access helps
Typefully offers API endpoints for X post and follower analytics. Programmatic access can connect those results to an internal workflow or let an agent query account performance. It still depends on available X data and sound measurement design. Teams need clear questions, comparable time windows, and a clean separation between measured outcomes and forecasts or recommendations.
The API matters most when reporting needs to leave the editor. It matters less when a creator only needs a readable dashboard for the next publishing decision.
The cleanest creator dashboard is not always the deepest measurement system. It is the one you will use before the next publishing decision.
Typefully is a weaker fit for competitor intelligence, detailed audience segmentation, or cross-platform reporting. Its scope is creator-focused, and pricing can be harder to assess because some rates appear inside the product. Choose Typefully when a fast X writing and analytics workspace is the priority.
3. TweetHunter
TweetHunter is an X-only growth platform built around publishing, AI-assisted writing, engagement management, and outreach. Its analytics sit inside a broader growth system that includes thread tools, a viral tweet library, CRM-style lists, and workflows for prioritizing interactions.
The key question is whether you want analytics to support an aggressive growth workflow or a lighter measurement routine. Founders and creators who actively research accounts, organize outreach, and turn successful ideas into new content may value having those activities in one X-focused environment. Teams that only need clean trend reports may find the automation and engagement layer heavier than necessary.
Analytics with a growth bias
TweetHunter's X specialization helps because the interface and workflows do not split attention across multiple social networks. You are working in one publishing environment, reviewing content performance, and moving directly into drafting or outreach. That supports retrospective learning, but it does not answer what a draft is likely to achieve before publication.
Pricing is publicly listed, and the product offers a 7-day trial according to its product information. Verify the current plan structure and X access requirements before building a process around it, since platform permissions and API conditions can change.
Its limitation is strategic as much as technical. TweetHunter is not designed for cross-network measurement, and its automation features may feel excessive if your growth model depends on selective, careful conversations. Compare it with lighter creator tools if your main need is execution rather than deeper measurement.
4. ilo
ilo takes a narrower approach. It is a creator-centric X analytics tool with a simple dashboard, live counters, posting streaks, and growth tracking. Email digests, iOS and Mac widgets, and a Chrome extension make it useful for people who want performance signals visible without opening a full social management suite.
That narrow scope is its main advantage. A solo creator may not need a CRM, campaign builder, or multi-network report generator. They may only need a quick view of whether publishing consistency is changing account growth and which posts deserve another look. ilo keeps that review lightweight and privacy-conscious, with browser-first workflows that reduce unnecessary data sharing.
Good for monitoring, not prediction
The Chrome extension adds profile research and export capabilities, which help when comparing public accounts or collecting examples during content research. Those features make ilo more useful than a dashboard that only reports on your own posts, but they do not create a full competitive intelligence system.
ilo's analytics are mainly retrospective. You can inspect what happened, track trends, and receive digest-style reminders, but the product is not positioned around explainable pre-publish forecast ranges or prediction replay. It also has no built-in scheduler or CRM, so you may need another tool for publishing and relationship management.
For a creator who wants clear X analytics without a large operational layer, ilo is a focused option. For teams measuring X alongside other networks, it is too narrow. For creators trying to connect draft quality with eventual follower conversion, it lacks a forward-looking loop.
5. Metricool
Metricool is designed for teams that want social analytics and reporting across a broader channel mix, with X support available through an add-on. Its X reporting includes impressions, comparisons, CSV exports, and optional hashtag tracking. Higher plans add automated PDF and PowerPoint reports plus a Looker Studio connector, which shifts the tool from personal review toward recurring stakeholder reporting.
The add-on model helps with budget planning because teams can separate general social management from X-specific coverage. It also makes Metricool a practical choice for small businesses that need dashboards and reports without adopting an enterprise suite. The trade-off is that X access and metric availability can change, so the current add-on scope should be checked before committing.
Strong reporting, limited learning loop
Metricool answers questions like which posts performed well, how channels compare, and what a client or manager should receive in a recurring report. It does not primarily answer whether a draft is likely to perform or whether a forecast was calibrated correctly after publication.
Historical depth also matters. Independent comparisons note that native X analytics may offer only roughly 28 to 90 days of history depending on access path, and that retention and access conditions vary across tools. That can make it harder to detect seasonality, content decay, or delayed follower conversion if you do not export data regularly. The Yubook best-time guidance is more relevant when the decision involves timing and prediction rather than reporting a recent window.
Metricool is best for cross-platform dashboards, automated reports, and hashtag-aware campaign review. It is less appropriate when X is the main growth engine and you want draft analysis, reply prioritization, or forecast-versus-actual replay.
6. Sprout Social
Sprout Social is built for organizations that need polished reporting, collaboration, governance, and broad social management. Its X coverage includes profile and post-level reporting across networks, while premium analytics and listening add deeper benchmarking and custom insights. Report sharing and export options are central to the product's value because the buyer is often serving managers, clients, or multiple stakeholders.
The workflow fit is different from a creator tool. Sprout Social helps a team standardize how people review account performance, share findings, and manage access. It is a stronger choice when reporting quality and operational control matter as much as the metrics themselves.
Premium depth comes with planning complexity
The add-on model lets teams expand into listening or premium analytics when the basic reporting layer no longer answers strategic questions. That flexibility can work well for agencies and brand teams, but it also complicates budgeting. Seat-based pricing may rise quickly as more collaborators, profiles, or advanced capabilities enter the process.
Sprout Social is not primarily a forecasting product. It explains measured activity, supports cross-network comparisons, and helps teams distribute reports. If you want to test a pre-publish range against actual X and Threads outcomes, you will need another workflow layer.
Independent market intelligence places the largest customer concentration for Twitter Analytics usage in the United States at 63.45%, followed by the United Kingdom at 14.08% and Canada at 6.36%, as reported by 6sense's Twitter Analytics market page. That reinforces a practical warning for global teams. Posting-time and conversion benchmarks should be validated by region instead of copied across audiences.
7. Rival IQ
Rival IQ is the clearest fit when the open question is not "how did my post perform?" but "how does my performance compare with relevant peers?" Its Twitter and X reporting includes impressions, clicks, replies, and other post metrics, while competitive post analysis and live benchmarks provide context that first-party dashboards usually lack.
That context changes interpretation. A post may look weak in isolation but perform well against the posting patterns and engagement levels of comparable accounts. Rival IQ also supports estimated competitor impressions, exports, automated reporting, and a Data Studio connector, which makes it useful for agencies preparing recurring client reviews.
Benchmarking is its core advantage
Rival IQ's strength is comparison, not pre-publish intervention. It can help identify content drivers, posting cadence patterns, and competitor formats worth studying. It cannot turn those observations into a guaranteed forecast for your next draft, and competitor estimates should be treated as directional rather than equivalent to your own private account data.
Some first-party or private analytics features begin on mid-tier plans, while pricing is aimed more at professional and agency budgets than solo creators. That makes sense if competitive context is billable work or a core strategic need. It is harder to justify if you only manage one account and need basic post-level feedback.
Use Rival IQ when your decisions involve positioning, category comparison, and client-ready benchmarking. Pair it with a creator-focused publishing tool if you also need draft guidance, timing experiments, or follower-conversion diagnostics.
8. Audiense
Audiense approaches X analytics from the audience outward. Its value lies in research, segmentation, interests, affinities, communities, influencer relationships, and audience-building workflows across X and other platforms. The legacy Twitter Marketing "Connect" functionality supports follower and community analysis, making Audiense more relevant to strategists than creators who only want a post-by-post dashboard.
A content report tells you what people did. Audience intelligence helps explain who those people are and which communities may matter next. That distinction matters for brands entering a category, agencies developing positioning, and analysts trying to connect social behavior with broader market strategy.
Better for strategic questions than daily checks
Audiense can support audience exports, multi-user access, and reporting outputs, but its quote-based pricing is geared toward teams and enterprises. It is likely excessive if your only question is which post earned the most engagement on one handle.
It also does not function as a forecast-versus-actual publishing loop. You may use its audience findings to shape a campaign or content strategy, then measure the campaign elsewhere. That division of labor can work well, provided the team records the original assumptions and later compares them with actual audience and conversion outcomes.
The platform's broad research scope is its differentiator. It can help identify affinities and communities that a simple X analytics tool will not expose. It is less suitable for a creator who needs immediate draft rewrites, a ranked reply queue, or a direct connection between profile visits and follows. Choose Audiense when segmentation is the decision.
9. SocialDog
SocialDog combines X analytics with scheduling, follower management, listening, inbox workflows, AI writing assistance, team roles, multi-profile support, and mobile apps. It is a good fit when the account's operational problem is bigger than reporting. You want to schedule posts, monitor mentions and keywords, review follower trends, and keep everyday account work in one X-focused environment.
The product's native orientation matters for creators and small businesses that spend most of their time on X. A broader social suite can add unnecessary navigation when the account is concentrated on one platform. SocialDog's workflow feels more like account operations than a dedicated analytics lab.
Useful operations, moderate analytics depth
Tweet analytics, follower trends, and best-post windows provide a practical feedback loop. You can maintain a queue, watch performance, and use the results to adjust future publishing. The system is less suited to advanced benchmarking, polished enterprise reports, or deep cross-platform measurement.
Mobile support is helpful for creators who monitor conversations away from a desktop, although feature coverage can differ between mobile and desktop workflows. Teams should also verify current permissions, retention windows, and export capabilities before treating SocialDog as their long-term historical record.
The biggest limitation is that SocialDog remains mainly retrospective. It helps you operate and review an X account, but it does not specialize in probability ranges before publishing or replaying predictions against actual outcomes. If you are comparing creator tools, use Yubook's X account check to assess the type of forward-looking analysis you need, then decide whether SocialDog's operational breadth is more valuable than forecast-led learning.
10. Tweet Binder
Tweet Binder is built around hashtags, keywords, accounts, and campaign tracking rather than daily publishing. It supports real-time and historical analysis, API access, exports to business intelligence workflows, and customizable PDF and Excel reports. That fits launches, events, research projects, and campaigns whose unit of measurement is a term or conversation, not just an owned account.
Its historical coverage is a notable differentiator. Product information describes access reaching back to 2006, which can support research involving older conversations and campaign context. Availability still depends on the query, platform conditions, and product arrangement, so teams should confirm the required coverage before committing to a historical study.
A campaign instrument, not a scheduler
Tweet Binder can show who contributed to a conversation, which hashtags or keywords attracted activity, and how campaign discussion changed over time. Programmatic access also supports repeatable reporting, campaign archives, and transfers into BI systems. This gives analysts more control than a dashboard limited to one account's retrospective metrics.
The trade-off is workflow complexity. Pricing may depend on credits or volume, while the interface and documentation can feel spread across multiple pages. Those constraints make more sense for a defined campaign with historical or API-oriented requirements than for a creator seeking daily post analytics.
Tweet Binder measures conversation-level activity well, but it does not provide a complete forecast-versus-actual publishing loop. It will not replace a scheduler, draft analyzer, or follower-conversion workflow. Its strongest fit is hashtag, keyword, event, and campaign measurement, paired with an owned-account tool for everyday publishing decisions.
Top 10 Twitter Analytics Tools Comparison
| Product | Core features | UX & value metrics | Target audience | Key USP & Pricing |
|---|---|---|---|---|
| Yubook | Pre-publish signal analysis & explainable forecast; browser-only draft studio; AI-assisted rewrites; one-click X+Threads publish; ranked reply queue | Transparent probabilistic forecasts; unified measurement; privacy-forward (cookieless counting); performance replays | Independent creators, founder-led growth teams, social managers, newsletter writers, content strategists | Explainable public-signal model; account-specific calibration; bilingual. $7.90/week or $69.90/year |
| Typefully | Writing-first scheduler; post & follower analytics; best-time insights; API access | Clean, fast UX; creator-focused analytics | Solo creators & small teams; API/agent workflows | Writer-centric scheduler + API-friendly; pricing varies / some rates in-app |
| TweetHunter | X scheduling & automation; AI writer and thread tools; CRM-style outreach; analytics | Integrated growth workflows; analytics tied to outreach | Founders and creators focused on aggressive growth and outreach | Deep X growth + CRM features; clear public pricing + 7-day trial |
| ilo | Clean analytics dashboard; live counters; Chrome extension; email digests & widgets | Simple, privacy-forward monitoring; low-cost | Individual creators wanting lightweight, private analytics | Browser-first privacy; transparent low-cost plans |
| Metricool | Multi-network dashboards; automated PDF/PPT reports; X analytics via add-on; Looker Studio connector | Good dashboards and report automation for SMBs | Small teams and SMBs needing dashboards & reports | Strong reporting value; X support as paid add-on |
| Sprout Social | Profile & post reporting across networks; premium analytics & listening add-ons; collaboration tools | Enterprise-grade reporting, governance and shareable exports | Teams and agencies needing polished reporting & workflows | Robust governance and collaboration; seat-based (higher) pricing |
| Rival IQ | Twitter/X reporting; competitive post analysis; live benchmarks; Data Studio connector | Excellent benchmarking and client-ready exports | Agencies and teams focused on competitor insights | Competitive benchmarking focus; professional/agency pricing |
| Audiense | Deep audience research & segmentation; legacy Twitter Marketing Connect; audience building for ads | Rich audience insights for strategy and segmentation | Analysts, strategists, and enterprise teams | Advanced segmentation & affinity data; quote-based pricing |
| SocialDog | Tweet analytics and follower trends; scheduling; inbox and AI assist; team roles & mobile apps | Native X workflows; affordable entry and clear tiers | Creators and SMBs managing day-to-day accounts | Free tier + clear paid tiers; purpose-built for X workflows |
| Tweet Binder | Real-time & historical hashtag/keyword tracking; API access; PDF/Excel exports | Campaign- and event-level analytics with backfill | Event teams, researchers, agencies needing hashtag analytics | Historical hashtag tracking back to 2006; credit/volume pricing |
Choose the Tool That Matches Your Measurement Loop
The right choice depends on the decision you want the data to support. Yubook fits teams that want pre-publish forecast ranges, X-to-Threads publishing, follower-conversion analysis, reply-target prioritization, and predicted-versus-actual replay. Typefully, ilo, SocialDog, and TweetHunter suit creator-focused X workflows, each with a different balance of writing, analytics, operations, and growth automation.
For cross-network reporting and collaboration, Metricool and Sprout Social make more sense. Metricool is practical for small teams that need dashboards, automated reports, exports, and X coverage through an add-on. Sprout Social is designed for more demanding reporting, governance, collaboration, premium analytics, and listening workflows.
Use Rival IQ when competitor benchmarking is the central requirement. Choose Audiense when the strategic question involves audience segmentation, interests, affinities, communities, or influencer intelligence rather than daily post review. Choose Tweet Binder for hashtag, keyword, historical, and API-oriented campaign analysis.
The market context supports treating analytics as operating infrastructure rather than optional reporting. The broader social media analytics market was estimated at USD 10,229.8 million in 2024 and is projected to reach USD 43,246.7 million by 2030, with a projected 27.2% compound annual growth rate from 2025 to 2030, according to Grand View Research's social media analytics market report. A separate forecast estimates growth from USD 12.9 billion in 2025 to USD 56.3 billion by 2035, at a projected 16.1% CAGR from 2026 to 2035, as reported in the Global Market Insights social media analytics analysis. Forecasts differ because market definitions and methodologies differ, but both point to sustained investment in measurement.
Access limitations deserve equal attention. BuiltWith trend data indicates Twitter/X Analytics appears on 21,283 live websites and has appeared on 855,974 websites overall, showing broad website-level adoption. That does not prove that every tool offers comparable account data. It does show why teams should distinguish public signals, first-party metrics, exports, and API-derived records before comparing dashboards.
Before subscribing, verify five things:
- Platform access: Confirm whether the tool uses first-party account authorization, public data, an API, or a mix.
- Retention windows: Check how much history remains available and whether you can export it before a plan or access path changes.
- Cross-platform scope: Confirm whether X is native, add-on based, or only loosely supported.
- Measurement objective: Decide whether you need retrospective reporting, audience research, campaign tracking, or a forecast.
- Actual learning loop: Ask whether the product lets you compare an expectation with measured results, not just rank past posts.
Then test the workflow in order. Define the decision the data must support. Connect one account or campaign. Establish a baseline using the metrics that matter to the decision. Run a consistent measurement period, preserve exports where possible, and review both the results and the tool's limitations. A tool earns its place when it improves the next decision, not when it produces the most attractive dashboard.
Yubook combines explainable pre-publish forecasts, X and Threads publishing, reply-target guidance, and follower-conversion analytics in one publishing-intelligence workflow. Visit Yubook to see whether predicted-versus-actual replay fits the way you evaluate X performance.
How to Choose a Twitter Analytics Platform
Every Twitter analytics platform answers a slightly different question, so the choice is less about feature counts and more about which decision the data has to support. Before comparing prices, decide whether the platform must explain past posts, guide the next post, or prove results to someone else. Four checks separate a platform that survives daily use from one that gets abandoned after a week.
- Data source and access. Ask whether metrics come from the official X API, from an authenticated account session, or from public scraping. API-based platforms are more stable but capped by plan limits; scraping breaks more often.
- Metric depth. Impressions and likes are table stakes. Profile visits, follow conversion, reply quality, link clicks, and negative feedback are what actually explain growth.
- History and export. A platform that only shows the last 28 days cannot support quarterly reporting. Look for long retention plus CSV, Sheets, or API export.
- Feedback loop. The most useful platforms compare what you expected with what happened, so each post teaches you something about your own audience.
Twitter Growth Tool vs Twitter Analysis Tools
These two categories are often sold together, but they solve opposite halves of the same problem. A Twitter growth tool acts before publication: it helps you draft, schedule, find reply opportunities, run follower sprints, and repeat formats that already work. Twitter analysis tools act after publication: they aggregate reach, engagement rate, audience composition, competitor benchmarks, and campaign performance.
Accounts under roughly 10,000 followers usually gain more from a growth tool, because their bottleneck is volume and consistency rather than measurement precision. Larger accounts and brand teams gain more from analysis tools, because they already publish enough to have statistically meaningful patterns and need to defend decisions with numbers.
The practical setup is one of each, connected to the same account: a growth tool that shapes drafts and timing, and an analysis tool that reports outcomes weekly. If budget allows only one, pick the side that matches your current bottleneck, then revisit the choice each quarter.
Twitter Search Analytics: Keywords, Hashtags, and Mentions
Twitter search analytics covers everything that happens outside your own timeline: how often a keyword, hashtag, product name, or competitor is mentioned, who mentions it, and how sentiment shifts over time. It answers demand questions that on-profile dashboards cannot, such as whether interest in a topic is rising before you commit to a content series.
- Keyword and hashtag volume over a chosen window, useful for spotting seasonality and launch spikes.
- Share of voice between your account and named competitors for the same term.
- Mention monitoring with alerts, so support and PR issues surface within hours rather than days.
- Contributor analysis that separates a handful of large accounts from genuine broad interest.
- Sentiment trend, best treated as directional rather than precise, especially for non-English posts.
Two caveats matter. Search coverage depends on API access tiers, so two platforms can report different totals for the same query; use one tool as your consistent baseline. And historical search almost always costs more than real-time monitoring, so define the date range you actually need before choosing a plan.
Best Tools for Twitter by Use Case
If you are simply looking for tools for Twitter without a fixed budget in mind, start from the job rather than the brand name.
- Solo creator growing an audience: a drafting-and-forecast tool such as Yubook or Typefully, paired with the native X analytics tab.
- Ghostwriter or agency managing several accounts: SocialDog or Metricool for multi-account operations and client-ready reports.
- Brand marketing team: Sprout Social for workflow depth, Rival IQ when competitive benchmarking is the priority.
- Research or audience strategy: Audiense for segment and affinity analysis, not for daily posting.
- Campaign or event measurement: Tweet Binder for hashtag campaign totals and contributor breakdowns.
- Lightweight monitoring only: ilo or the native dashboard, which is often enough below a few thousand followers.
Frequently Asked Questions
What is the best Twitter analytics tool for beginners?
Start with the native X analytics tab plus one lightweight external tool. Native data is authoritative for impressions and profile visits, while an external tool adds history, exports, and comparisons that the native view discards.
Is there a free Twitter analytics platform?
Yes, though free tiers are usually capped at one account and a short retention window. That is generally enough to validate whether you will use analytics consistently before paying for longer history or team seats.
Can Twitter analysis tools track competitors?
They can track public metrics such as posting cadence, engagement rate, follower trend, and top posts. Private data such as impressions or click-through on someone else's account is never available.
How reliable is a Twitter growth tool's forecast?
Forecasts are probabilistic ranges, not guarantees. They become useful after a few dozen posts from the same account, because calibration depends on your own audience behaviour rather than a global average.
Do these tools work for X, not just Twitter?
Every tool listed here operates on X. The word "Twitter" persists in search queries and tool names, but the underlying platform, API, and metrics are X's.