What Is Reach on Social Media and Why It Matters
Learn what reach on social media means, how it differs from impressions and views, and why it matters for content strategy, forecasting, and growth.
Upkeep · 2026-08-30 · 36 min
Reach on social media is the number of unique accounts that saw a post, while impressions count total displays, including repeat views from the same account. One person can therefore contribute one reach count but multiple impressions.
Social media analytics often appear straightforward until the dashboard presents several metrics that seem to tell different stories. A post may generate strong views, visible engagement, and multiple profile visits, yet still report modest reach. That does not necessarily indicate poor performance. It usually reflects the fact that platforms measure different behaviors and label them inconsistently.
The practical advantage comes from identifying which metric represents distinct people, which reflects repeat exposure, and which records content playback. Once those definitions are clear, analytics become far easier to interpret and use in decision-making.
Table of Contents
- Why Your Reach Number Feels So Confusing
- Reach, Impressions, and Views Explained Together
- How Different Platforms Surface Reach
- Organic, Paid, and Viral Reach Compared
- The Long Decline of Organic Reach
- How Reach Connects to Followers and Forecasts
- Reach as a Distribution Health Signal
Why Your Reach Number Feels So Confusing
A creator reviews a post after a day of replies and shares. The dashboard shows a healthy view count, a higher impressions figure, and a reach number that appears comparatively modest. Profile visits sit in a different part of the report, while engagement suggests the content resonated. The central question becomes: which number should inform the next publishing decision?
Each metric answers a different question:
- Reach: How many unique accounts saw the content?
- Impressions: How many total times was the content displayed?
- Views: How many times did the platform count a playback or other defined viewing event?
- Profile visits: How many visits did the account or profile receive?
- Engagement: How many tracked actions did people take?
Reach is the primary audience-size metric in that group. Instagram describes reach as accounts reached, meaning unique accounts that saw content at least once. TikTok uses a similar concept for video reach, defining it as the total number of unique accounts that watched a video.
This distinction matters because a post can be displayed repeatedly to a relatively small audience. If the same account sees a post more than once, it contributes only once to reach but adds again to impressions. A high impressions count may indicate useful repetition, but it does not automatically mean the post reached a broad audience.
Practical rule: Start with reach when the question is how widely a message travelled. Use impressions to understand how often people encountered it.
Platform labels add another layer of complexity. Some networks display reach directly, some use a term such as members reached, and others emphasize views or impressions instead. The dashboard becomes easier to interpret once comparisons shift away from labels and toward definitions. The key question is always: does this number count unique accounts, total displays, or viewing events?
Reach, Impressions, and Views Explained Together
These three metrics can be understood as different measurement layers around the same piece of content.
Reach counts people or accounts. It represents the unique accounts that saw the content at least once. An account that encounters a post once and an account that encounters it several times still contribute the same amount to reach.
Impressions count exposures. They measure the total number of times content was displayed, including repeat displays from the same account. As Conbersa's explanation of social media reach shows, one account viewing a post three times contributes one to reach and three to impressions.
Views count playback events according to platform rules. A view may depend on a platform-defined playback duration or another viewing condition. That means views are not interchangeable with reach, even when both appear in a video dashboard.
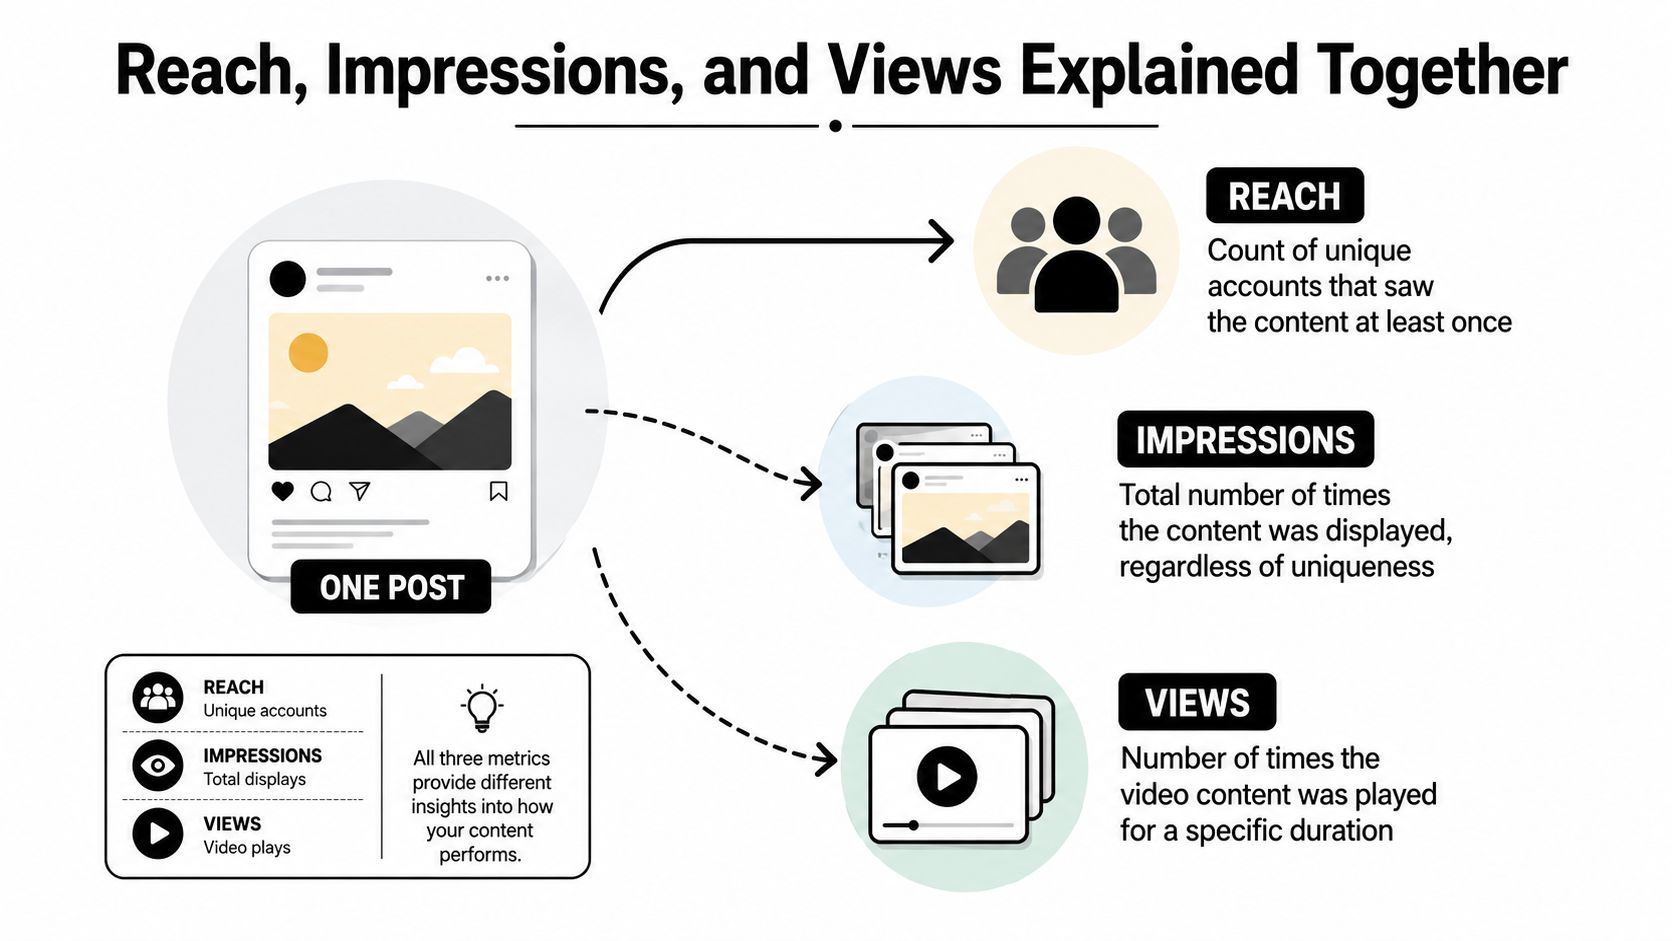
Consider one viewer who watches a short video twice, then opens it again after someone shares it back to them. Reach still counts one unique account. Impressions count the total displays recorded by the platform, including repeat exposure. Views depend on the platform's playback rule, so that number should be interpreted using the platform's own definition rather than treated as another name for reach.
This is why the relationship reach = impressions ÷ average frequency is useful as a practical explanation, as described in Sprout Social's reach and impressions guide. It clarifies how a post can accumulate many impressions without reaching an equally large number of distinct accounts.
The simplest working distinction is:
- Reach is about people.
- Impressions are about exposures.
- Views are about playback.
Use reach to assess distribution breadth. Use impressions to evaluate repetition and recall. Use views to determine whether video content generated counted playbacks under a platform's measurement rules.
How Different Platforms Surface Reach
Platforms do not surface reach in a consistent way, which makes cross-network comparisons easy to misinterpret. The practical task is to identify the platform's closest measure of audience breadth, then confirm whether its definition matches the question being asked.
| Platform | Native label | Closest proxy if reach is hidden | Public or gated |
|---|---|---|---|
| Accounts reached | Not usually needed | Analytics access | |
| Reach | Not usually needed | Page or post insights | |
| TikTok | Reach may appear for video analytics | Unique viewers or watchers | Analytics access |
| YouTube | No single reach total | Unique viewers, impressions, and traffic sources | YouTube Studio |
| X | Impressions | No consistently native unique-reach total | Analytics access varies |
| Members reached | Unique members reached | Page or post analytics |
Instagram's accounts reached gives creators a direct view of how broadly content was distributed. Facebook's reach serves a similar function inside Page or post insights. These labels are useful starting points, but they still belong to separate measurement systems, so a larger figure on one network does not automatically indicate stronger distribution.
TikTok centers much of its reporting on video views and watcher-related measures. If a unique-account measure is available, use it as the closest reach equivalent. Before comparing it with Instagram or Facebook, confirm in the relevant dashboard what the platform includes.
YouTube requires a different interpretation. Its analytics combine impressions, click-through behavior, traffic sources, and viewer metrics instead of presenting one universal reach total. A comparison with Instagram should specify whether the focus is unique viewers, thumbnail exposure, or viewing behavior. Those are different dimensions of distribution performance.
X emphasizes impressions in its native reporting. That figure is useful for assessing exposure volume and repeat delivery, while the absence of a consistently native unique-reach total limits direct audience-breadth comparisons. LinkedIn's members reached is the closest native equivalent for professional content.
Cross-platform rule: Compare like with like. Use unique accounts or viewers to assess audience breadth, impressions to assess exposure volume, and views to assess playback. Comparing one platform's impressions with another platform's reach does not produce a valid performance benchmark.
For forecasting audience expansion, record the closest unique-account measure available and store the platform definition beside it. If no unique measure exists, label the result as an estimate. Over time, that disciplined record reveals whether distribution is widening, stalling, or relying on repeated exposure to the same audience.
Organic, Paid, and Viral Reach Compared
A single reach total can combine three distinct distribution paths that behave differently under platform delivery systems. Organic exposure comes from follower feeds, recommendations, and other unpaid distribution. Paid exposure comes from ads, boosts, or purchased placements. Viral exposure comes from shares, reposts, mentions, recommendations, and similar network effects.
| Reach Type | How It's Generated | What It Signals | How Creators Should Read It |
|---|---|---|---|
| Organic | Algorithmic and follower-based distribution without paid amplification | Content relevance and audience response | Check whether the format and topic earn continued distribution |
| Paid | Ads, boosts, or other purchased placements | Targeting and creative delivery | Separate audience quality from delivery volume |
| Viral | Shares, recommendations, reposts, and discovery surfaces | Shareability and network expansion | Identify which idea gave people a reason to pass the content on |
Organic reach may represent only a narrow share of an account's followers, especially for niche creators whose potential audience is smaller or less active. The industry benchmark for social media reach provides useful context, but the range for any account still depends on platform distribution, content format, audience activity, and engagement. Treat the benchmark as a comparison point, not a forecast.
Paid reach answers a separate question: did a selected audience and creative combination produce useful exposure? A larger paid audience does not prove that the content earned stronger organic interest. Keep paid and unpaid results separate, then compare downstream actions such as profile visits, follows, or meaningful responses.
Viral reach indicates whether distribution is expanding beyond the starting audience. A shared or recommended post can reach unfamiliar viewers, but that exposure becomes valuable only when the topic and framing give them a reason to continue. Review which idea, format, or message motivated people to pass it on.
Read the source of reach alongside the total. If organic reach drops while paid reach remains stable, review content distribution rather than assuming ad delivery failed. If viral reach rises, examine the replies, framing, and topic associated with that spread. Reach is therefore a distribution-health signal because its mix helps forecast whether future exposure can grow without requiring payment for every additional impression.
If distribution seems unusually restricted, use a structured shadowban check for social accounts rather than guessing from one post. One result is evidence to investigate, not a diagnosis.
The Long Decline of Organic Reach
Organic reach did not decline overnight. It weakened as major platforms shifted from follower-only feeds toward ranked recommendations, paid inventory, and content selected by recommendation systems. The direction is clear, although benchmarks vary by platform and measurement method.
A historical comparison in Contentmation's analysis of social media algorithm reach decline reports Facebook average organic reach falling from about 26% of page followers in 2014 to 5.2% in 2026. The same source also summarizes a decline from roughly 16% in the early 2010s to 1.37% in 2025. These figures should be treated as separate reference points rather than collapsed into one universal rate. Together, they illustrate why follower count no longer predicts how many people will see a post.
Instagram shows a similar pattern in the available benchmarks. One 2026 benchmark places organic reach at 9.8% of followers, compared with 16% in 2020, while other summaries report lower figures and continued declines. The practical lesson is not to apply a historical follower-based assumption to current distribution. Use recent reach records from your own account instead.
| Platform | 2012 | 2016 | 2020 | 2024 |
|---|---|---|---|---|
| Benchmark varies by source | Organic distribution had declined from earlier levels | Continued algorithmic filtering | Organic exposure remained constrained | |
| Comparable benchmark not established in the provided data | Distribution increasingly shaped by ranking | Benchmark cited at 16% of followers | Continued dependence on format and recommendations |
This shift changes how creators should plan content. Repeating a follower-first strategy can produce less exposure even as the account grows. Shares, replies, watch time, and recommendation placement can move a post beyond existing followers, so track which formats and topics create that distribution.
Reach is a changing condition, not a permanent account trait. Record discovery by format, conversation by topic, and non-follower exposure by posting surface. If views have dropped, use this guide to investigating dropped views to examine the distribution pattern before deciding the account has failed. That diagnosis helps forecast whether the next post can recover exposure through better distribution, rather than treating a lower number as a verdict on the content or audience.
How Reach Connects to Followers and Forecasts
Reach sits at the top of the follower-growth funnel. An account cannot gain followers from people who never encountered it, so unique exposure is the first input in any realistic growth model.
Use a simple sequence:
- Record unique reach. Capture the number of distinct accounts reached by each post.
- Measure profile movement. Compare reach with profile visits or other account-level actions.
- Calculate follower conversion. Divide new follows attributable to the post by its reach.
- Build a range. Use several posts instead of relying on the strongest result.
- Adjust for churn and cadence. New follows do not equal lasting growth if people later unfollow or if publishing frequency changes.
For example, if a post reaches 10,000 unique accounts and converts 1% of them into followers, the arithmetic suggests roughly 100 followers, before other factors affect the result. Those figures are provided as a planning example in the brief, not as a universal conversion benchmark. Conversion rates vary according to topic, profile clarity, audience intent, and the distance between the post and the account's central promise.
A useful forecast is a range, not a single promise. Reach can change from post to post even when the account, subject, and publishing routine appear stable. Build a low, central, and high scenario from recent observed results, then update the range as new posts are published.
Forecasting is not about pretending reach is perfectly predictable. It is about making uncertainty visible before it disrupts the plan.
Weekly reach multiplied by follower conversion provides a basic acquisition view. Add posting cadence to estimate how many opportunities are being created, and account for churn before calling the result net growth. For scheduling experiments, compare observed reach with the timing patterns documented in this guide to when to post, but evaluate the outcome using your own account data.
This video places the same funnel in a visual publishing context:
Reach as a Distribution Health Signal
A declining reach trend is often the first measurable sign that distribution is tightening, even before follower growth slows. Reach shows how many distinct accounts had an opportunity to encounter your content, including people outside your follower base. That makes it a practical indicator of how broadly the platform is testing and circulating each post.
Use reach together with impressions to diagnose the pattern. If impressions rise while reach stays flat, the same people may be seeing the content repeatedly. If reach rises while impressions remain relatively stable, the platform may be testing the post with more new accounts instead of serving it repeatedly to the same viewers. The relationship often matters more than either number in isolation.
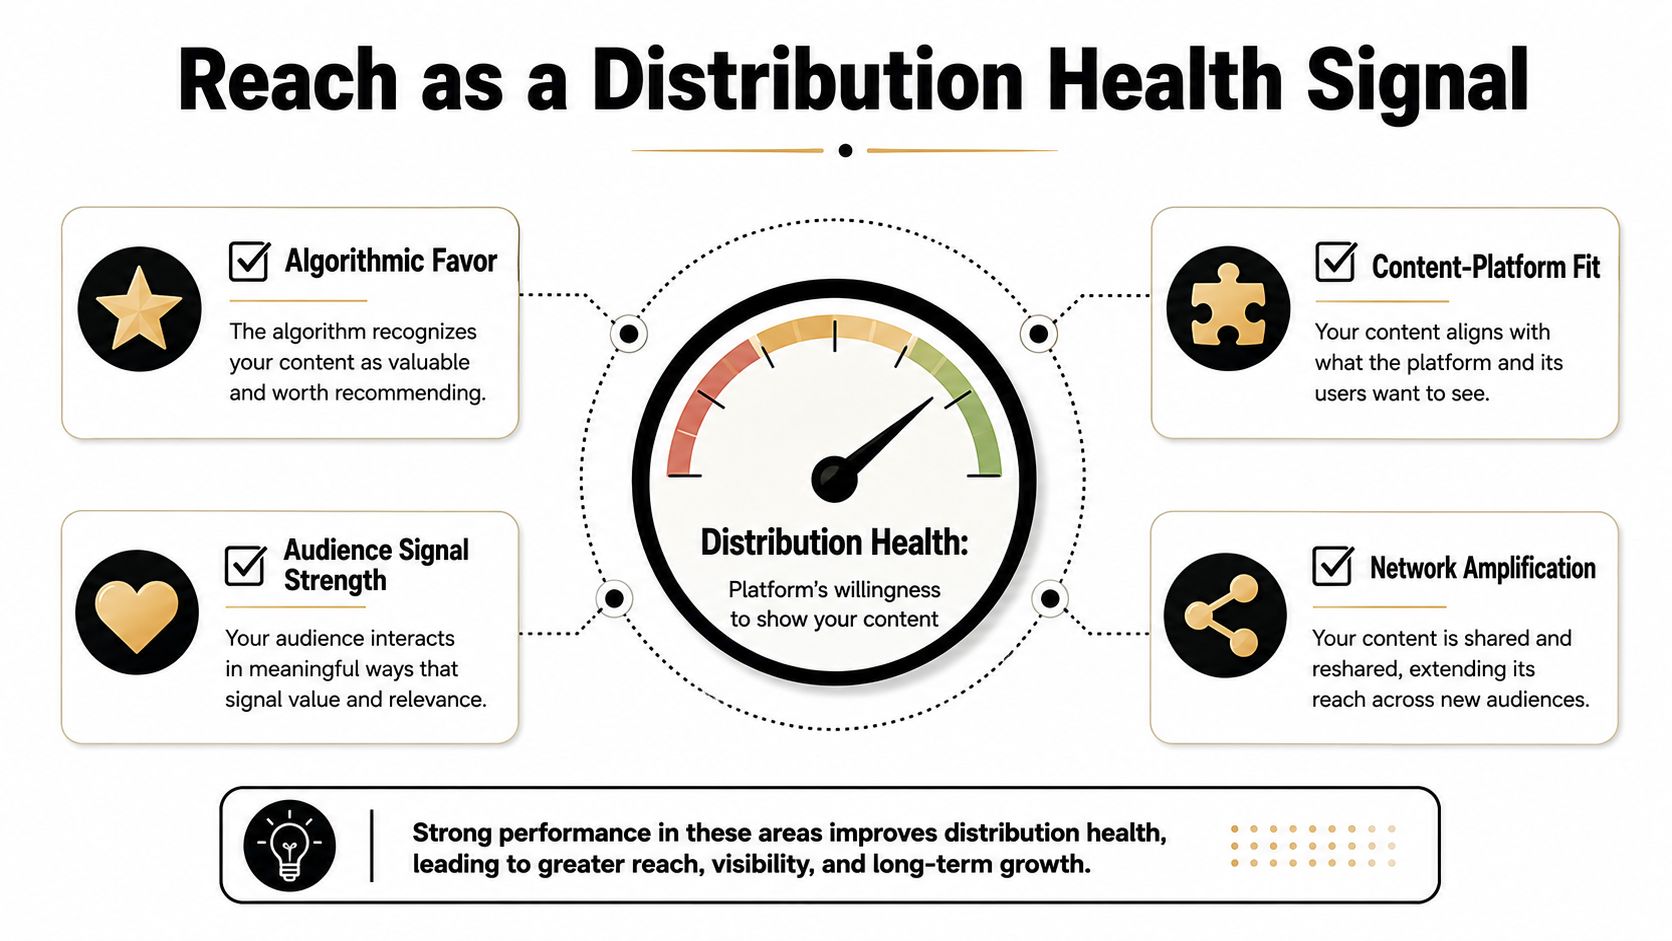
A reach decline calls for a controlled test, not a complete content reset:
- Review the opening: Check whether the first moments make the topic and payoff clear.
- Test a different pillar: Address another audience need with a related idea rather than repeating the same angle.
- Inspect response quality: Review replies, shares, saves, and profile actions alongside reach.
- Compare publishing spacing: A crowded calendar can make it harder to connect a result with the post that caused it.
- Separate format effects: Compare text, image, and video posts within their own groups.
Record reach and impressions each week alongside the publishing calendar. After several cycles, compare changes with shifts in topic, format, timing, and conversation behavior. This turns a disappointing number into a testable distribution question: which change affected how many distinct accounts received the post?
Yubook provides draft signal analysis, a pre-publish reach forecast range for X, and performance replay comparing predicted with actual results after publishing. Visit Yubook to examine how that workflow connects expected reach with measured follower conversion on X and Threads.